. 2018 Jun;28(6):836-845.
doi: 10.1101/gr.228171.117. Epub 2018 May 4.

The HUSH complex cooperates with TRIM28 to repress young retrotransposons and new genes

Affiliations

The HUSH complex cooperates with TRIM28 to repress young retrotransposons and new genes

Luisa Robbez-Masson et al. Genome Res. 2018 Jun.

Abstract

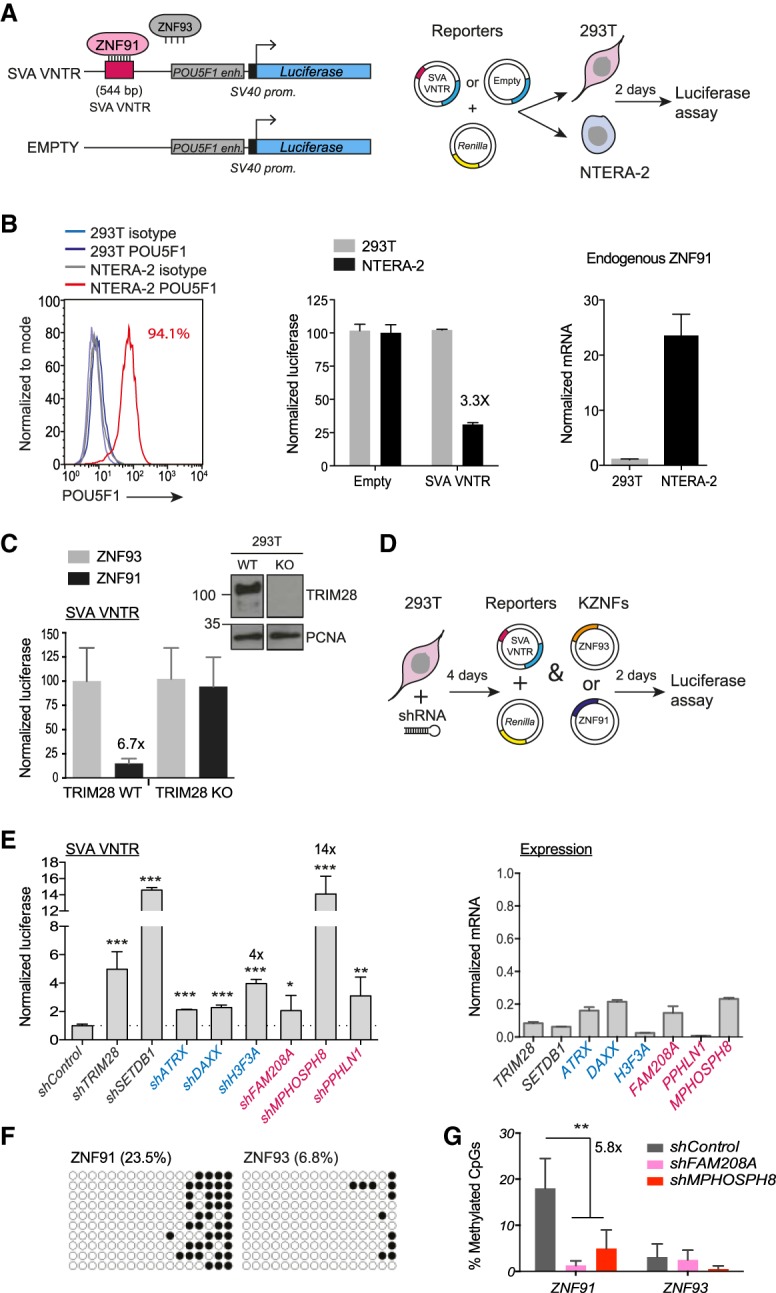
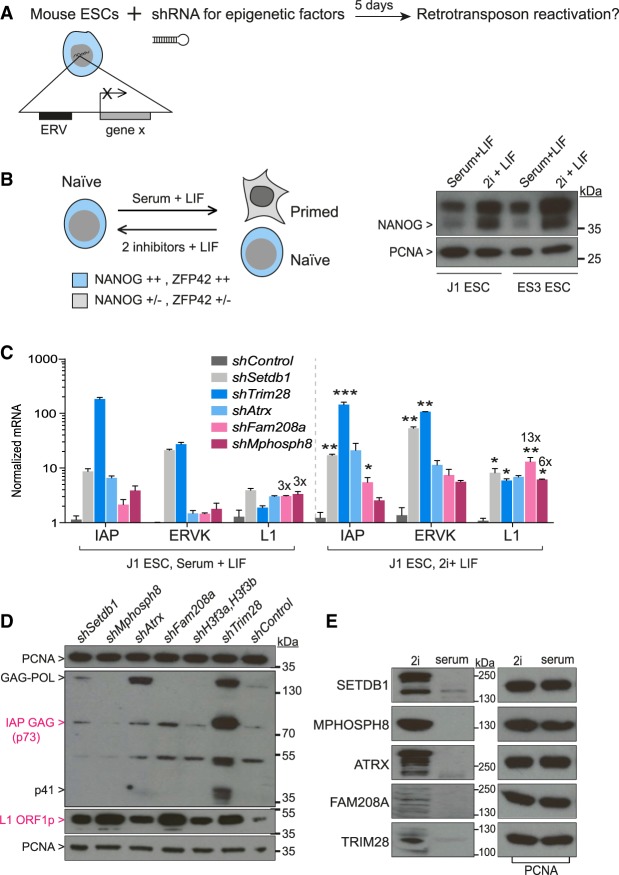
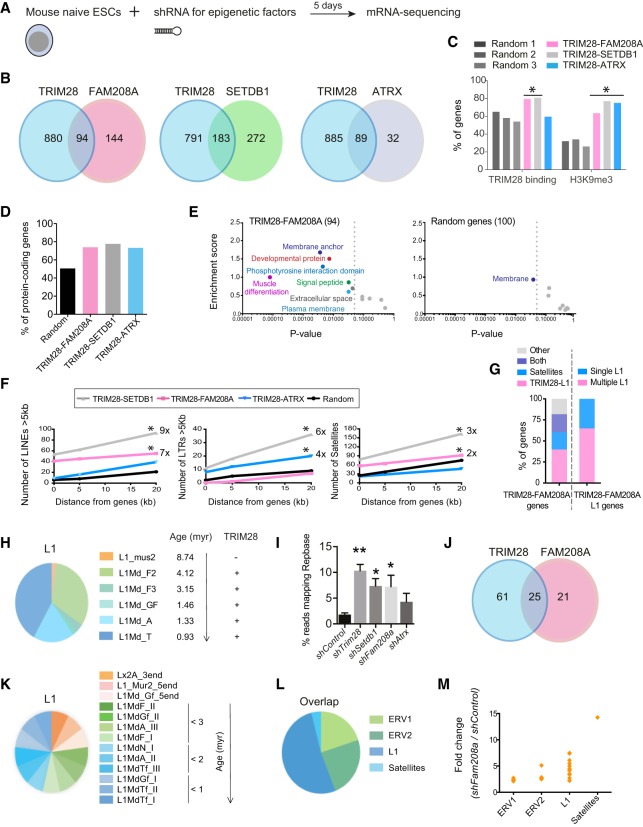
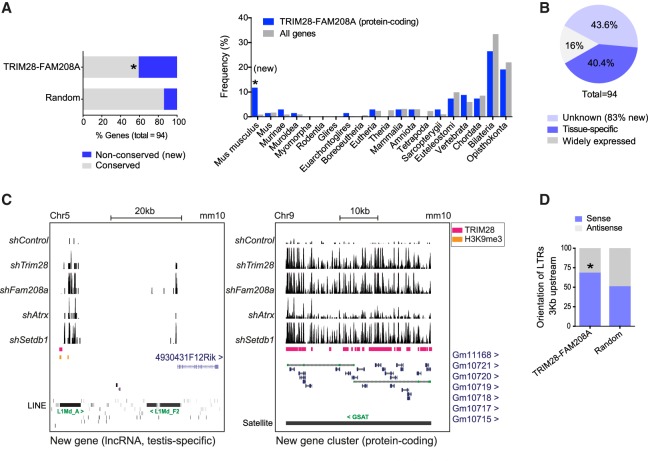
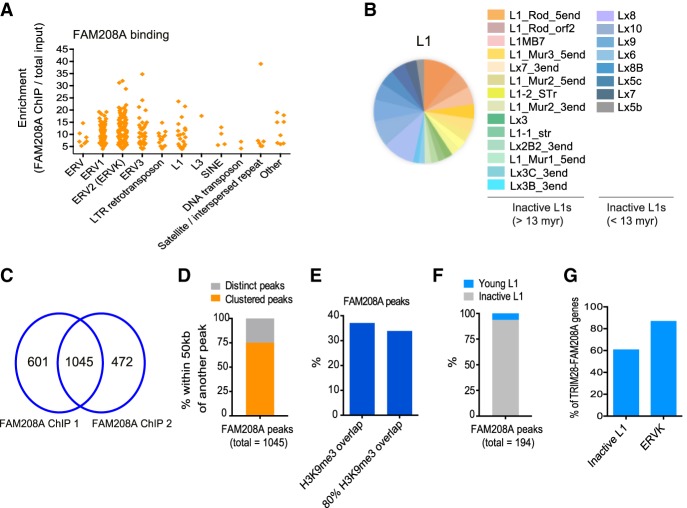
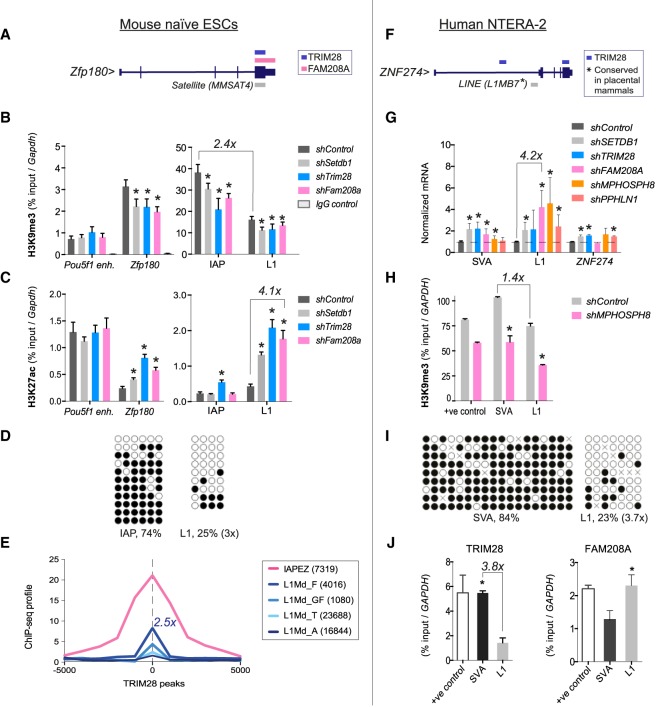
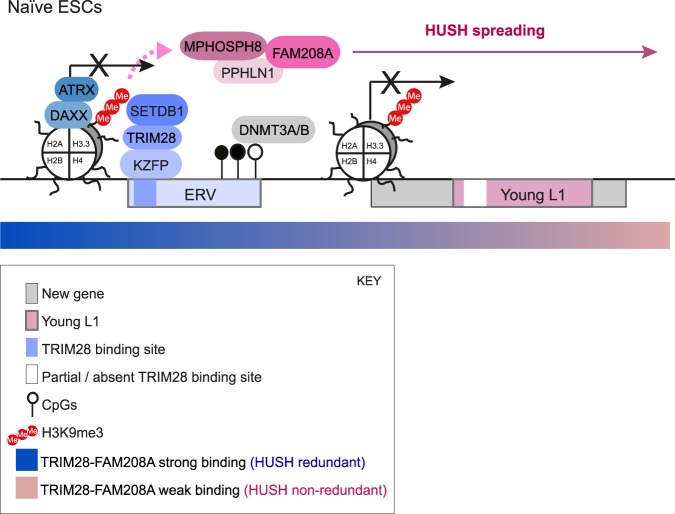
Retrotransposons encompass half of the human genome and contribute to the formation of heterochromatin, which provides nuclear structure and regulates gene expression. Here, we asked if the human silencing hub (HUSH) complex is necessary to silence retrotransposons and whether it collaborates with TRIM28 and the chromatin remodeler ATRX at specific genomic loci. We show that the HUSH complex contributes to de novo repression and DNA methylation of an SVA retrotransposon reporter. By using naïve versus primed mouse pluripotent stem cells, we reveal a critical role for the HUSH complex in naïve cells, implicating it in programming epigenetic marks in development. Although the HUSH component FAM208A binds to endogenous retroviruses (ERVs) and long interspersed element-1s (LINE-1s or L1s), it is mainly required to repress evolutionarily young L1s (mouse-specific lineages <5 million years old). TRIM28, in contrast, is necessary to repress both ERVs and young L1s. Genes co-repressed by TRIM28 and FAM208A are evolutionarily young, or exhibit tissue-specific expression, are enriched in young L1s, and display evidence for regulation through LTR promoters. Finally, we demonstrate that the HUSH complex is also required to repress L1 elements in human cells. Overall, these data indicate that the HUSH complex and TRIM28 co-repress young retrotransposons and new genes rewired by retrotransposon noncoding DNA.


Figures

Figure 1.
Figure 1.
The HUSH complex contributes to repression and DNA methylation of an SVA retrotransposon reporter. (A, left) ZNF91 binds the SVA VNTR sequence and represses the reporter. ZNF93 or an empty reporter were used as controls. (enh.) enhancer; (prom.) promoter; (SV40) simian virus 40. (Right) Either luciferase reporter was cotransfected with a Renilla luciferase-encoding control, and relative luciferase light units were measured 48 h later. (B) NTERA-2 cells were verified to express POU5F1 (left) and subject to reporter assays shown in A (middle), here normalized to the empty control, and ZNF expression was measured by qRT-PCR (right). (C) Reporter assays in TRIM28 WT and KO 293T cells, including cotransfection of stated exogenous ZNFs. Data are normalized to the bar on the left (TRIM28 WT, ZNF93). Western blot for TRIM28 using PCNA as a loading control (insets from the same blot). (D) 293T cells were transduced with shRNA vectors against epigenetic factors and puromycin-selected before reporter assays. (E) Following the assay in D, data for ZNF91 were normalized to ZNF93 (left). Unpaired t-tests were used to assess differences between the shControl (transduced with the same vector lacking a hairpin that was puromycin-selected in parallel) and the target shRNA. Experiments were repeated at least three times for each candidate, and representative data are shown. Two-tailed unpaired t-tests were done: (*) P = <0.05; (**) P = <0.01; (***) P = <0.001. qRT-PCR was used to assess the knockdown efficiency of each mRNA (right). (F) DNA methylation analysis of the SV40 promoter 48 h post reporter transfection. Plasmids were produced in dam bacteria. Methylated and unmethylated CpGs are shown as filled and open circles, respectively. (G) Summary results of levels of de novo DNA methylation of the reporter in control cells versus HUSH-depleted cells. See also Supplemental Figure S1G. Two-tailed, unpaired t-tests were used to compare four controls to four HUSH-depleted samples (from two independent experiments): P = 0.0062.
Figure 2.
Figure 2.
The HUSH complex is critical for endogenous retrotransposon repression in naïve pluripotent cells. (A) Endogenous retrotransposon expression was measured by qRT-PCR following shRNA-depletion of epigenetic modifiers in mESCs. (B) Naïve cells express higher levels (++) of ZFP42 (REX1) and NANOG (left), the latter shown by Western blot in two mESC strains (right). Predicted band sizes: NANOG, 34 kDa; PCNA, 29 kDa. (C) Endogenous retrotransposon expression following depletion of epigenetic modifiers. One representative experiment of three is shown. Atrx was not examined in the third experiment, excluding it from statistical analyses. Two-tailed paired t-tests were done for 2i + LIF samples. (D) Western blot for IAP GAG p73 using a rabbit IAP GAG antibody or PCNA as control in 2i + LIF J1 ESCs. The antibody detects p73 as well as GAG-POL and GAG cleavage products, including p41, representing partially processed GAG. Samples were re-run on a second gel and reblotted for L1 ORF1 protein (40 kDa) and reprobed for PCNA. (E) J1 ESCS grown in serum versus 2i conditions were blotted for epigenetic factors or PCNA as a normalizer. Predicted band sizes: SETDB1, 143 kDa; MPHOSPH8, 97 kDa; ATRX, 280 kDa; FAM208A, 200 kDa; KAP1, 100 kDa.
Figure 3.
Figure 3.
TRIM28 and FAM208A exert nonredundant roles at evolutionarily young L1s and associated genes. (A) Naïve knockdown J1 mESCs were subject to mRNA-sequencing. Biological replicates were sequenced from three independent experiments. (B) Genes up-regulated >2× (where Padj ≤ 0.05) in each treatment group showing the overlap between groups. (C) The three gene sets or three random gene sets (the latter containing 100 per group) were examined for the presence of a TRIM28 or H3K9me3 peak within a radius of 20 kb. (D) Percentage of protein-coding genes in each group. (E) Gene ontology (DAVID analysis) of the 94 TRIM28-FAM208A repressed genes (left, seven gene clusters were enriched with P-values <0.05) and the 100 random genes (right). (F) UCSC Table Browser analysis showing the number of the stated repeats located within increasing distances (0, 5, and 20 kb) of the sets of genes. Significant gene sets are marked and the fold change relative to random genes at intersection (0 kb) is stated where different. (Left) TRIM28-FAM208A, P = 0.000025; TRIM28-SETDB1, P = 0.002540; (middle) TRIM28-ATRX, P = 0.010200; TRIM28-SETDB1, P = 0.035700; (right) TRIM28-FAM208A, P = 0.00643; TRIM28-SETDB1, P = 0.00428. (G) The percentage of TRIM28-FAM208A genes that contain the stated repeats (left bar) or the percentage of L1-containing TRIM28-FAM208A genes that contain multiple L1s (right bar). Only TRIM28-dependent L1s are considered (from the families L1Md_F, L1Md_F2, L1Md_F3, L1Md_A, and L1Md_T). (H) Full-length (>5 kb) L1 elements located within 20 kb of the TRIM28-FAM208A genes were classified according to family and mean age of that family and whether (+/−) they bind TRIM28. (I) The percentage of reads mapping Repbase within each treatment group is shown (n = 3, except for ATRX where n = 2). Error bars represent standard deviation or standard error (ATRX). (J) Venn diagram showing 25 repeat families are co-repressed by TRIM28 and FAM208A. They are defined as >2× up-regulated (P = <0.05) in both Trim28 and Fam208a-depleted cells. (K) All L1 families co-repressed by TRIM28 and FAM208A are classified here by name and age. (L) Proportion of repeats from each class that are co-repressed by TRIM28 and FAM208A. (M) The same repeat families as L, but here, their up-regulation in Fam208a-depleted cells is shown.
Figure 4.
Figure 4.
TRIM28-FAM208A coregulated genes are enriched in tissue-specific and new genes. (A, left) TRIM28-FAM208A genes and random genes were scored as conserved if they had at least 80% conservation across placental mammals (using the UCSC Table Browser). For the TRIM28-FAM208A genes, the nonconserved ones were verified to be mouse-specific using the Ensembl GeneTree. Fisher's exact test one-sided P-value = 2.204 × 10⁻⁵. (Right) Only protein-coding TRIM28-FAM208A genes (n = 68) were selected and their Last Common Ancestor extracted from the Ensembl database (version 90) using R version 3.3.1, compared to all genes in the mouse genome. Fisher's exact tests on 2 × 2 tables were significant for Mus musculus (P = 1.58 × 10⁻⁷). (B) Expression patterns of the 94 TRIM28-FAM208A genes were assessed using https://biogps.org. (C) mRNA-sequencing tracks of naïve J1 mESCs depleted of the stated epigenetic factors. TRIM28 peaks (Castro-Diaz et al. 2014) and TRIM28-dependent H3K9me3 (Rowe et al. 2013b) shown. See also Supplemental Figure S4. (D) 3 kb regions were identified upstream of each TRIM28-FAM208A coregulated gene or the random genes, and the orientation of all LTRs in these regions was assessed using the UCSC Table Browser. In the TRIM28-FAM208A group, LTRs were shown to be biased to be in a sense orientation (P = 0.005692, Fisher's exact one-sided test).
Figure 5.
Figure 5.
FAM208A binds primarily to ERVs and L1 elements. (A) Reads from TI and FAM208A IP samples were mapped to rodent Repbase. Duplicates were averaged and RPKM ratios calculated between TIs and IPs. Repeats were selected giving ≥fourfold enrichment in the IPs. The ERV2 class includes ERVK elements from ETN and IAP families. (B) All L1 elements from A are displayed here with family name and age. (C) After mapping reads to mm10, 1045 peaks were identified (present in both duplicates and not in the TIs). (D) Peaks from C were sorted into those that clustered by their presence within 50 kb of a second FAM208A peak. (E) Intersection of FAM208A peaks with H3K9me3 peaks (either any overlap or 80% overlap considered). (F) FAM208A peaks from C overlap with young versus inactive L1s. (G) TRIM28-FAM208A genes were assessed for the percentage that contain either an inactive L1 (from the families L1_Rod, L1MB7, L1_Mur1, L1_Mur2, L1_Mur3, Lx8, Lx9, and Lx10) or an ERVK within 20 kb.
Figure 6.
Figure 6.
FAM208A represses L1s in leaky heterochromatin/euchromatin. (A) UCSC map of the Zfp180 locus showing TRIM28 and FAM208A binding sites and overlapping repeats (see also Supplemental Fig. S6A). (B,C) H3K9me3 and H3K27ac ChIPs on naïve mESCs. Results are representative of two (in the case of H3K9me3) or three (in the case of H3K27ac) independent IPs per treatment group performed on chromatin from the same experiment (sonicated independently), and error bars show standard deviation of all IPs, each analyzed in technical triplicates by qPCR. IgG control ChIPs gave background enrichments (ranging from 0.006 to 0.043) displayed on the H3K9me3 graph. Results are normalized to Gapdh and the Pou5f1 enhancer was used as an additional control region. Two-tailed unpaired t-tests were performed: (*) P-values <0.05. (D) DNA methylation of endogenous multicopy IAPs and L1s. (E) TRIM28 binding (Castro-Diaz et al. 2014) enrichment correlation with the stated repeat families using ChIP-cor. (F) Human ZNF274 locus showing TRIM28 binding and the presence of a conserved L1 that is bound by FAM208A in mouse cells (Fig. 5). (G) qRT-PCR of retrotransposon expression (one representative experiment of three). (H) H3K9me3 ChIP, following Mphosph8 depletion. Results are normalized to GAPDH as a negative region. +ve control; TRIM28 positive control region nearby ZNF239 (Iyengar et al. 2011). Unpaired t-tests were performed: (*) P-values <0.05. (I) DNA methylation of endogenous multicopy SVAs and L1s. (J) ChIP-PCRs using antibodies to detect TRIM28 or FAM208A binding to SVA and L1 elements. Results are representative of two independent IPs per treatment group, and error bars show standard deviation of both IPs each analyzed in technical triplicates by qPCR. IgG control ChIPs gave only background enrichment (Supplemental Fig. S7). Results are normalized to GAPDH. Positive control for TRIM28: see H; for FAM208A, we used TAF7.
Figure 7.
Figure 7.
Model. ERVs recruit KZFPs, TRIM28, SETDB1, DNMT3A/B, and the H3.3/ATRX/DAXX complex. FAM208A also binds to ERVs and is known to interact with H3K9me3 through MPHOSPH8. FAM208A binding spreads through chromatin and overlaps H3K9me3, suggesting HUSH uses H3K9me3 as a platform on which to spread. TRIM28 is required to repress ERVs but FAM208A is not, likely because it is redundant at these sites of dense H3K9me3. Young L1s, in contrast, reside in “leaky heterochromatin” or part euchromatin, which exhibits weak TRIM28 and FAM208A binding and low levels of H3K9me3 and DNA methylation. Both TRIM28 and FAM208A exert nonredundant roles at young L1s. These sites are also rich in new and tissue-specific genes and are flanked by upstream sense LTRs. This suggests that genes may hijack repeats and incomplete epigenetic repression to rewire their expression patterns.

Similar articles

Cited by

References

    1. Barde I, Laurenti E, Verp S, Groner AC, Towne C, Padrun V, Aebischer P, Trumpp A, Trono D. 2009. Regulation of episomal gene expression by KRAB/KAP1-mediated histone modifications. J Virol 83: 5574–5580. - PMC - PubMed
    1. Benjamini Y, Hochberg Y. 1995. Controlling the false discovery rate: a practical and powerful approach to multiple testing. J R Statist Soc Ser B 57: 289–300.
    1. Brummelkamp TR, van Steensel B. 2015. GENE REGULATION. A HUSH for transgene expression. Science 348: 1433–1434. - PubMed
    1. Cammas F, Mark M, Dolle P, Dierich A, Chambon P, Losson R. 2000. Mice lacking the transcriptional corepressor TIF1β are defective in early postimplantation development. Development 127: 2955–2963. - PubMed
    1. Carelli FN, Hayakawa T, Go Y, Imai H, Warnefors M, Kaessmann H. 2016. The life history of retrocopies illuminates the evolution of new mammalian genes. Genome Res 26: 301–314. - PMC - PubMed

Publication types