Functional and genomic characterisation of a xenograft model system for the study of metastasis in triple-negative breast cancer
- PMID: 29720474
- PMCID: PMC5992606
- DOI: 10.1242/dmm.032250
Functional and genomic characterisation of a xenograft model system for the study of metastasis in triple-negative breast cancer
Abstract
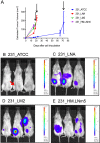
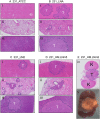
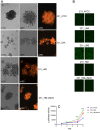
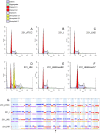
Triple-negative breast cancer (TNBC) represents 10-20% of all human ductal adenocarcinomas and has a poor prognosis relative to other subtypes. Hence, new molecular targets for therapeutic intervention are necessary. Analyses of panels of human or mouse cancer lines derived from the same individual that differ in their cellular phenotypes but not in genetic background have been instrumental in defining the molecular players that drive the various hallmarks of cancer. To determine the molecular regulators of metastasis in TNBC, we completed a rigorous in vitro and in vivo characterisation of four populations of the MDA-MB-231 human breast cancer line ranging in aggressiveness from non-metastatic to spontaneously metastatic to lung, liver, spleen and lymph node. Single nucleotide polymorphism (SNP) array analyses and genome-wide mRNA expression profiles of tumour cells isolated from orthotopic mammary xenografts were compared between the four lines to define both cell autonomous pathways and genes associated with metastatic proclivity. Gene set enrichment analysis (GSEA) demonstrated an unexpected association between both ribosome biogenesis and mRNA metabolism and metastatic capacity. Differentially expressed genes or families of related genes were allocated to one of four categories, associated with either metastatic initiation (e.g. CTSC, ENG, BMP2), metastatic virulence (e.g. ADAMTS1, TIE1), metastatic suppression (e.g. CST1, CST2, CST4, CST6, SCNNA1, BMP4) or metastatic avirulence (e.g. CD74). Collectively, this model system based on MDA-MB-231 cells should be useful for the assessment of gene function in the metastatic cascade and also for the testing of novel experimental therapeutics for the treatment of TNBC.This article has an associated First Person interview with the first author of the paper.
Keywords: Breast cancer; Metastasis; Mouse model; Triple-negative; Xenograft.
© 2018. Published by The Company of Biologists Ltd.
Conflict of interest statement
Competing interestsThe authors declare no competing or financial interests.
Figures


Similar articles
-
FGF13 promotes metastasis of triple-negative breast cancer.Int J Cancer. 2020 Jul 1;147(1):230-243. doi: 10.1002/ijc.32874. Epub 2020 Feb 24. Int J Cancer. 2020. PMID: 31957002
-
Integration of whole-genome sequencing and functional screening identifies a prognostic signature for lung metastasis in triple-negative breast cancer.Int J Cancer. 2019 Nov 15;145(10):2850-2860. doi: 10.1002/ijc.32329. Epub 2019 Apr 29. Int J Cancer. 2019. PMID: 30977117
-
EP300 knockdown reduces cancer stem cell phenotype, tumor growth and metastasis in triple negative breast cancer.BMC Cancer. 2020 Nov 10;20(1):1076. doi: 10.1186/s12885-020-07573-y. BMC Cancer. 2020. PMID: 33167919 Free PMC article.
-
Combination of the novel histone deacetylase inhibitor YCW1 and radiation induces autophagic cell death through the downregulation of BNIP3 in triple-negative breast cancer cells in vitro and in an orthotopic mouse model.Mol Cancer. 2016 Jun 10;15(1):46. doi: 10.1186/s12943-016-0531-5. Mol Cancer. 2016. PMID: 27286975 Free PMC article.
-
Applications of RNA Indexes for Precision Oncology in Breast Cancer.Genomics Proteomics Bioinformatics. 2018 Apr;16(2):108-119. doi: 10.1016/j.gpb.2018.03.002. Epub 2018 May 9. Genomics Proteomics Bioinformatics. 2018. PMID: 29753129 Free PMC article. Review.
Cited by
-
KISS1 in breast cancer progression and autophagy.Cancer Metastasis Rev. 2019 Sep;38(3):493-506. doi: 10.1007/s10555-019-09814-4. Cancer Metastasis Rev. 2019. PMID: 31705228 Free PMC article. Review.
-
ceRNA network development and tumour-infiltrating immune cell analysis of metastatic breast cancer to bone.J Bone Oncol. 2020 Jul 20;24:100304. doi: 10.1016/j.jbo.2020.100304. eCollection 2020 Oct. J Bone Oncol. 2020. PMID: 32760644 Free PMC article.
-
Loss of MXRA8 Delays Mammary Tumor Development and Impairs Metastasis.Int J Mol Sci. 2023 Sep 6;24(18):13730. doi: 10.3390/ijms241813730. Int J Mol Sci. 2023. PMID: 37762032 Free PMC article.
-
Multimodal AI for prediction of distant metastasis in carcinoma patients.Front Bioinform. 2023 May 9;3:1131021. doi: 10.3389/fbinf.2023.1131021. eCollection 2023. Front Bioinform. 2023. PMID: 37228671 Free PMC article.
-
Characterization of triple-negative breast cancer preclinical models provides functional evidence of metastatic progression.Int J Cancer. 2019 Oct 15;145(8):2267-2281. doi: 10.1002/ijc.32270. Epub 2019 Apr 2. Int J Cancer. 2019. PMID: 30860605 Free PMC article.
References
-
- Aslakson C. J. and Miller F. R. (1992). Selective events in the metastatic process defined by analysis of the sequential dissemination of subpopulations of a mouse mammary tumor. Cancer Res. 52, 1399-1405. - PubMed
Publication types
MeSH terms
Substances
LinkOut - more resources
Full Text Sources
Other Literature Sources
Molecular Biology Databases
Research Materials
Miscellaneous

