Improving RNA nearest neighbor parameters for helices by going beyond the two-state model
- PMID: 29718397
- PMCID: PMC6007268
- DOI: 10.1093/nar/gky270
Improving RNA nearest neighbor parameters for helices by going beyond the two-state model
Abstract
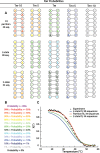
RNA folding free energy change nearest neighbor parameters are widely used to predict folding stabilities of secondary structures. They were determined by linear regression to datasets of optical melting experiments on small model systems. Traditionally, the optical melting experiments are analyzed assuming a two-state model, i.e. a structure is either complete or denatured. Experimental evidence, however, shows that structures exist in an ensemble of conformations. Partition functions calculated with existing nearest neighbor parameters predict that secondary structures can be partially denatured, which also directly conflicts with the two-state model. Here, a new approach for determining RNA nearest neighbor parameters is presented. Available optical melting data for 34 Watson-Crick helices were fit directly to a partition function model that allows an ensemble of conformations. Fitting parameters were the enthalpy and entropy changes for helix initiation, terminal AU pairs, stacks of Watson-Crick pairs and disordered internal loops. The resulting set of nearest neighbor parameters shows a 38.5% improvement in the sum of residuals in fitting the experimental melting curves compared to the current literature set.
Figures


Similar articles
-
Nearest neighbor rules for RNA helix folding thermodynamics: improved end effects.Nucleic Acids Res. 2022 May 20;50(9):5251-5262. doi: 10.1093/nar/gkac261. Nucleic Acids Res. 2022. PMID: 35524574 Free PMC article.
-
The determination of RNA folding nearest neighbor parameters.Methods Mol Biol. 2014;1097:45-70. doi: 10.1007/978-1-62703-709-9_3. Methods Mol Biol. 2014. PMID: 24639154 Review.
-
A set of nearest neighbor parameters for predicting the enthalpy change of RNA secondary structure formation.Nucleic Acids Res. 2006;34(17):4912-24. doi: 10.1093/nar/gkl472. Epub 2006 Sep 18. Nucleic Acids Res. 2006. PMID: 16982646 Free PMC article.
-
Blind tests of RNA nearest-neighbor energy prediction.Proc Natl Acad Sci U S A. 2016 Jul 26;113(30):8430-5. doi: 10.1073/pnas.1523335113. Epub 2016 Jul 8. Proc Natl Acad Sci U S A. 2016. PMID: 27402765 Free PMC article.
-
Measuring the thermodynamics of RNA secondary structure formation.Biopolymers. 1997;44(3):309-19. doi: 10.1002/(SICI)1097-0282(1997)44:3<309::AID-BIP8>3.0.CO;2-Z. Biopolymers. 1997. PMID: 9591481 Review.
Cited by
-
Vfold2D-MC: A Physics-Based Hybrid Model for Predicting RNA Secondary Structure Folding.J Phys Chem B. 2021 Sep 16;125(36):10108-10118. doi: 10.1021/acs.jpcb.1c04731. Epub 2021 Sep 2. J Phys Chem B. 2021. PMID: 34473508 Free PMC article.
-
Nearest neighbor rules for RNA helix folding thermodynamics: improved end effects.Nucleic Acids Res. 2022 May 20;50(9):5251-5262. doi: 10.1093/nar/gkac261. Nucleic Acids Res. 2022. PMID: 35524574 Free PMC article.
-
Thermodynamics and kinetics of DNA and RNA dinucleotide hybridization to gaps and overhangs.Biophys J. 2023 Aug 22;122(16):3323-3339. doi: 10.1016/j.bpj.2023.07.009. Epub 2023 Jul 19. Biophys J. 2023. PMID: 37469144 Free PMC article.
-
Diversity of Self-Assembled RNA Complexes: From Nanoarchitecture to Nanomachines.Molecules. 2023 Dec 19;29(1):10. doi: 10.3390/molecules29010010. Molecules. 2023. PMID: 38202593 Free PMC article.
-
The shaping of a molecular linguist: How a career studying DNA energetics revealed the language of molecular communication.J Biol Chem. 2021 Jan-Jun;296:100522. doi: 10.1016/j.jbc.2021.100522. Epub 2021 Apr 7. J Biol Chem. 2021. PMID: 34237886 Free PMC article.
References
-
- Markham N.R., Zuker M.. Keith JM. UNAFold. Bioinformatics. 2008; 453:Totowa: Humana Press; 3–31.
Publication types
MeSH terms
Substances
Grants and funding
LinkOut - more resources
Full Text Sources
Other Literature Sources

