. 2018 May 1;9(1):1759.
doi: 10.1038/s41467-018-03907-4.

Non-canonical activation of DAPK2 by AMPK constitutes a new pathway linking metabolic stress to autophagy

Affiliations

Non-canonical activation of DAPK2 by AMPK constitutes a new pathway linking metabolic stress to autophagy

Ruth Shiloh et al. Nat Commun. .

Abstract

Autophagy is an intracellular degradation process essential for adaptation to metabolic stress. DAPK2 is a calmodulin-regulated protein kinase, which has been implicated in autophagy regulation, though the mechanism is unclear. Here, we show that the central metabolic sensor, AMPK, phosphorylates DAPK2 at a critical site in the protein structure, between the catalytic and the calmodulin-binding domains. This phosphorylation activates DAPK2 by functionally mimicking calmodulin binding and mitigating an inhibitory autophosphorylation, providing a novel, alternative mechanism for DAPK2 activation during metabolic stress. In addition, we show that DAPK2 phosphorylates the core autophagic machinery protein, Beclin-1, leading to dissociation of its inhibitor, Bcl-XL. Importantly, phosphorylation of DAPK2 by AMPK enhances DAPK2's ability to phosphorylate Beclin-1, and depletion of DAPK2 reduces autophagy in response to AMPK activation. Our study reveals a unique calmodulin-independent mechanism for DAPK2 activation, critical to its function as a novel downstream effector of AMPK in autophagy.


Conflict of interest statement

The authors declare no competing interests.

Figures

Fig. 1
Fig. 1
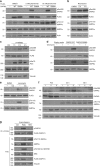
AMPK phosphorylates DAPK2 on Ser289. a DAPK2-K42A was subjected to an in vitro kinase assay with AMPK and resolved by SDS–PAGE. A sample without AMPK was used as control. The gel was stained with GelCode Blue and the DAPK2 bands in each sample were excised and analyzed by liquid chromatography-mass spectrometry/mass spectrometry (LC–MS/MS) as shown in the graphs. Each peak represents a peptide; the graph height represents the relevant abundance of the peptide in the fraction. b AMPK was incubated with either DAPK2 K42A or DAPK2 K42A S289A in a kinase reaction mixture containing 32P-labeled ATP. Reactions were resolved by SDS–PAGE and exposed to X-ray film. c AMPK was incubated with either DAPK2 K42A or DAPK2 K42A S289A in a kinase reaction mixture. Reactions were resolved by SDS-PAGE and reacted with an antibody raised against pSer289 DAPK2. d Multiple sequence alignment of different DAPK2 orthologues using ClustalOmega. Ser289 is marked with an arrow. e A scheme showing the different domains of DAPK2. Ser289 is marked with an arrow
Fig. 2
Fig. 2
DAPK2 is phosphorylated on Ser289 upon AMPK activation. a HCT116 cells were transfected with FLAG-DAPK2 WT, S289A or empty vector and treated with 5 mM/10 mM phenformin or DMSO for 4 h. b HCT116 cells were transfected with FLAG-DAPK2 WT and treated with 250 μM resveratrol for 2/3 h. c HCT116 cells were transfected with FLAG-DAPK2 WT and treated with 100 μM A-769662 for 1/2/4 h. d A549 cells were transfected with FLAG-DAPK2 WT, S289A or empty vector and treated with 5 μM ionomycin for 2 h. e A549 cells were transfected with FLAG-DAPK2 and treated with 10μM ionomycin or DMSO for 1 h, with or without the addition of 5 μM compound C. f Mice were fasted for either 24 or 48 h, or fed normally, as control. Muscle tissue from three different mice at each condition was extracted and protein lysates were subjected to western blots. g HCT116 cells were transfected with FLAG-DAPK1 and treated with 200 µM resveratrol for 2 h or serum-starved overnight and then treated with 100 nM PMA for 30 min. Anti-FLAG immunoprecipitates were resolved by SDS–PAGE. DAPK1 Ser289 phosphorylation was monitored using an antibody that recognizes the sequence RXRXXpSer/Thr, which was previously shown to specifically detect phosphorylation of DAPK1 on Ser289. In all panels, experiments were repeated three times and representative immunoblots are shown
Fig. 3
Fig. 3
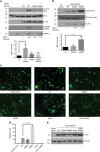
Ser289 phosphorylation enhances DAPK2’s catalytic activity. a Sequential kinase assays of AMPK on FLAG-DAPK2 in AMPK kinase buffer, and then of DAPK2 on MLC in DAPK2 kinase assay buffer. Phosphorylation was assessed by western blotting of the reaction mixtures. Bar graph represents pMLC intensity as mean ± SD of three independent repeats. Statistical analyses were performed using one-way ANOVA with post hoc Dunnett’s multiple comparison test. *P < 0.05. b FLAG-DAPK2 WT, S289A or S289D was incubated in a kinase reaction mixture with MLC, and phosphorylation assessed by western blotting of the reaction mixtures. pMLC band intensity was quantified using NIH ImageJ software. Bar graph represents pMLC intensity as mean ± SD of three independent repeats. Statistical analyses were performed using one-way ANOVA with post hoc Dunnett’s multiple comparison test. **P < 0.01. c HEK293T cells were transfected with GFP and the indicated constructs, and imaged after 24 h. Scale bar=100 µm. d Quantification of the extent of blebbing among GFP-positive cells. Bar graph represents percent of blebbed cells as mean ± SD of three independent repeats. Statistical analyses were performed using one-way ANOVA with post hoc Dunnett’s multiple comparison test. ****P < 0.0001. e Western blot of a representative experiment from c
Fig. 4
Fig. 4
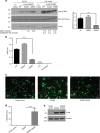
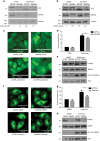
Ser289 phosphorylation provides a CaM-independent mechanism of activation. a FLAG-DAPK2 WT, S289A or S289D was incubated in a kinase reaction mixture with MLC. Reactions were carried out with the addition of either EGTA or Ca2+/CaM. pMLC band intensity was quantified using NIH ImageJ software. The fold increase ratio upon addition of Ca2+/CaM was calculated by dividing the calculated intensity of the Ca2+/CaM lanes with the calculated intensity of the respective EGTA lanes. Bar graph represents CaM/EGTA fold increase as mean ± SD of three independent repeats. Statistical analyses were performed using one-way ANOVA with post hoc Dunnett’s multiple comparison test. ***P < 0.001. b ELISA plates were coated with CaM and incubated with DAPK2 WT or different mutants. Bar graph represents quantification of DAPK2 binding as mean ± SD of three technical repeats from one representative experiment out of three independent repeats. Statistical analyses were performed using one-way ANOVA with post hoc Dunnett’s multiple comparison test. ****P < 0.0001. c HEK293T cells were transfected with GFP and the indicated constructs and imaged 24 h post-transfection. Scale bar=100 µm. d Quantification of the extent of blebbing among GFP-positive cells. Bar graph represents percent of blebbed cells as mean ± SD of three biological repeats. Statistical analyses were performed using one-way ANOVA with post hoc Dunnett’s multiple comparison test. ****P < 0.0001. e Western blot of a representative experiment from c
Fig. 5
Fig. 5
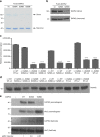
Ser289 phosphorylation reduces dimerization and autophosphorylation. a FLAG-DAPK2 WT and mutants were overexpressed in HEK293T cells and immunoprecipitated using anti-FLAG antibody. Immunoprecipitated protein was resolved by SDS-PAGE and the gel was stained with GelCode Blue. A representative gel of three independent experiments is shown. b FLAG-DAPK2 WT and mutants were overexpressed in HEK293T cells and resolved by SDS–PAGE. The upper part of the membrane, corresponding to the DAPK2 dimer size, was reacted with anti-FLAG antibody diluted 1:1000, and the lower part of the membrane, corresponding to the DAPK2 monomer size, was reacted with anti-FLAG 1:500,000. A representative immunoblot of three independent experiments is shown. c HEK293T cells were transfected with different combinations of L1 and L2-fused DAPK2 WT and mutants, and luminescence was measured. Bar graph represents dimerization level as mean ± SD of three technical repeats. Statistical analyses were performed using one-way ANOVA with post hoc Dunnett’s multiple comparison test. ****P < 0.0001 indicates significant decrease in dimerization of all DAPK2 pairs containing a S289D/S289E mutant compared to WT. d Expression of the different constructs was assessed using anti-gaussia luciferase antibody that detects both L1 and L2 on western blot. e FLAG-DAPK2 WT, S289A or S289D was incubated with MLC in a kinase reaction mixture containing 32P-labeled ATP. Reactions were resolved by SDS–PAGE and exposed to X-ray film. pMLC band intensity was quantified using NIH ImageJ software
Fig. 6
Fig. 6
DAPK2 binds Atg14 and phosphorylates Beclin-1, leading to its dissociation from Bcl-XL. a HEK293T cells were transfected with Atg14-HA and FLAG-DAPK2. Anti-HA immunoprecipitates were resolved by SDS-PAGE and reacted with the indicated antibodies. Representative immunoblots of 3 independent experiments are shown. b FLAG-DAPK2 was incubated with His-Beclin-1 in a kinase reaction mixture. Representative immunoblots of 3 independent experiments are shown. c HEK293T cells were transfected with FLAG-Beclin-1 and HA-DAPK2. Anti-FLAG immunoprecipitates were resolved by SDS–PAGE and reacted with the indicated antibodies. Representative immunoblots of three independent experiments are shown. d HEK293T cells were transfected with BCL-XL-L1 and either Beclin-1-L2 WT or T119E. Cells were lysed and luminescence was measured. Bar graph represents binding level as mean ± SD of three technical repeats. Statistical analyses were performed using unpaired two-tailed Student’s t-test. ****P < 0.0001. e Western blot of d
Fig. 7
Fig. 7
Ser289 phosphorylation enhances DAPK2’s ability to phosphorylate Beclin-1. Sequential kinase assays of AMPK on FLAG-DAPK2 in AMPK kinase buffer, and then of DAPK2 on Beclin-1 in DAPK2 kinase assay buffer. Phosphorylation was assessed by western blotting of the reaction mixtures. Bar graph represents pBeclin-1 intensity as mean ± SD of two independent repeats. Statistical analyses were performed using one-way ANOVA with post hoc Dunnett’s multiple comparison test. *P < 0.05
Fig. 8
Fig. 8
DAPK2 mediates autophagy induction in response to AMPK activation. a HCT116 cells were transfected with siRNA targeting DAPK2 or with non-targeting siRNA and treated with 5 mM phenformin for 4 h or left untreated as control. Representative immunoblots of 3 independent experiments are shown. b A549 cells were transfected with siRNA targeting DAPK2 or with non-targeting siRNA and treated with 10μM ionomycin or DMSO for 1 h. *Non-specific band. Representative immunoblots of three independent experiments are shown. c HEK293 GFP-LC3B cells were transfected with siRNA targeting DAPK2 or with non-targeting siRNA and treated with 5 mM phenformin for 2 h or left untreated as control. Cells were fixed and imaged and puncta area/cell area was measured using MetaMorph software. Scale bar=20 µm. Additional images are shown in Supplementary Figure 4. d Bar graph represents puncta area/cell area as mean ± SD of three biological repeats. Statistical analyses were performed using unpaired two-tailed Student’s t-test. *P < 0.05. e Western blot of a representative experiment. *Non-specific band. f A549-DFCP1-GFP cells were transfected with siRNA targeting DAPK2 or with non-targeting siRNA and treated with 10 μM ionomycin or DMSO for 1 h. Cells were fixed and imaged and puncta area/cell area was measured using MetaMorph software. Scale bar=20 µm. Additional images are shown in Supplementary Figure 5. g Bar graph represents puncta area/cell area as mean ± SD of three biological repeats. Statistical analyses were performed using unpaired two-tailed Student’s t-test. *P < 0.05. h Western blot of a representative experiment
Fig. 9
Fig. 9
Ser289 resides in a critical position in the DAPK2 structure. a Ribbon diagram of the DAPK2 dimer (PDB code 2A2A). The two monomers are shown in gray and purple. The C-terminal part (residues 290–304), containing part of the CaM binding helix, is marked in gold, the basic loop (residues 46–56) is in dark green and Ser289 is in red (marked with an arrow). An ATP molecule marks the position of the catalytic cleft. b Proposed mechanism of activation by Ser289 phosphorylation. In the inactive state, the CaM binding domain (in light green) blocks the catalytic cleft, Ser308 is autophosphorylated, and DAPK2 is dimeric. Dimerization is mediated in part by interaction of the basic loop (in dark green) with the CaM auto-regulatory domain of the other monomer. CaM binding or Ser289 phosphorylation activate DAPK2 by shifting the CaM binding domain away from the kinase domain, thus exposing the catalytic cleft, reducing Ser308 autophosphorylation and decreasing dimerization. The C-terminal tail of DAPK2 is not represented in this scheme since it is lacking from the available crystal structures

Similar articles

Cited by

References

    1. Feng Y, et al. The machinery of macroautophagy. Cell Res. 2014;24:24–41. doi: 10.1038/cr.2013.168. - DOI - PMC - PubMed
    1. Ohsumi Y. Historical landmarks of autophagy research. Cell Res. 2014;24:9–23. doi: 10.1038/cr.2013.169. - DOI - PMC - PubMed
    1. Yang Z, Klionsky DJ. Eaten alive: a history of macroautophagy. Nat. Cell Biol. 2010;12:814–822. doi: 10.1038/ncb0910-814. - DOI - PMC - PubMed
    1. Mizushima N, et al. In vivo analysis of autophagy in response to nutrient starvation using transgenic mice expressing a fluorescent autophagosome marker. Mol. Biol. Cell. 2004;15:1101–1111. doi: 10.1091/mbc.E03-09-0704. - DOI - PMC - PubMed
    1. Itakura E, et al. Beclin 1 forms two distinct phosphatidylinositol 3-kinase complexes with mammalian Atg14 and UVRAG. Mol. Biol. Cell. 2008;19:5360–5372. doi: 10.1091/mbc.E08-01-0080. - DOI - PMC - PubMed

Publication types

MeSH terms

LinkOut - more resources