. 2018 May;24(5):563-571.
doi: 10.1038/s41591-018-0010-1. Epub 2018 Apr 30.

Determinants of response and resistance to CD19 chimeric antigen receptor (CAR) T cell therapy of chronic lymphocytic leukemia

Affiliations

Determinants of response and resistance to CD19 chimeric antigen receptor (CAR) T cell therapy of chronic lymphocytic leukemia

Joseph A Fraietta et al. Nat Med. 2018 May.

Erratum in

Abstract

Tolerance to self-antigens prevents the elimination of cancer by the immune system1,2. We used synthetic chimeric antigen receptors (CARs) to overcome immunological tolerance and mediate tumor rejection in patients with chronic lymphocytic leukemia (CLL). Remission was induced in a subset of subjects, but most did not respond. Comprehensive assessment of patient-derived CAR T cells to identify mechanisms of therapeutic success and failure has not been explored. We performed genomic, phenotypic and functional evaluations to identify determinants of response. Transcriptomic profiling revealed that CAR T cells from complete-responding patients with CLL were enriched in memory-related genes, including IL-6/STAT3 signatures, whereas T cells from nonresponders upregulated programs involved in effector differentiation, glycolysis, exhaustion and apoptosis. Sustained remission was associated with an elevated frequency of CD27+CD45RO-CD8+ T cells before CAR T cell generation, and these lymphocytes possessed memory-like characteristics. Highly functional CAR T cells from patients produced STAT3-related cytokines, and serum IL-6 correlated with CAR T cell expansion. IL-6/STAT3 blockade diminished CAR T cell proliferation. Furthermore, a mechanistically relevant population of CD27+PD-1-CD8+ CAR T cells expressing high levels of the IL-6 receptor predicts therapeutic response and is responsible for tumor control. These findings uncover new features of CAR T cell biology and underscore the potential of using pretreatment biomarkers of response to advance immunotherapies.


Conflict of interest statement

Competing interests

J.A.F., S.F.L., F.B., R.M.Y., B.L.L., J.L.B., D.L.P., C.H.J. and J.J.M. hold patents related to CTL019 cell therapy. These authors declare no additional interests. The remaining authors declare no competing interests.

Figures
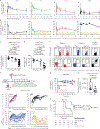
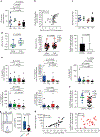
Fig. 1|
Fig. 1|. The intrinsic potency of CAR T cells from patients with CLL drives response to therapy.
a, Expansion kinetics of peripheral blood CTL019 cells from patients with CLL. b, Peripheral blood B cell counts from matched patients. In a and b, graphs show mean± s.d.; shaded areas, detection limit (CR, n = 8; PRTD, n = 3; PR, n = 5; NR, n = 25). c, Peak expansion of CTL019 cells (log10 copies per microgram genomic DNA). d, Persistence of CTL019 cells in evaluable patients, shown by AUC calculations (log10 copies per microgram genomic DNA from day 0 to maximum expansion time by day 180). In c and d, P values were calculated with two-tailed Mann-Whitney tests. Symbols, individual patients; bars, s.e.m. (CR, n = 8; PRTD, n = 2–3; PR, n = 5; NR, n = 25). e, Flow cytometric plots of peripheral blood CAR T cells (top) and B cells (bottom) in two CR patients at 1 and 5.5 years postinfusion, compared with a control ubject (representative of 2 independent experiments). f, Top, schema of CAR T cell transfer into leukemic mice. Bottom, longitudinal tumor burden (BLI) of CTL019-treated mice (each line represents one mouse). g, Longitudinal weight loss in mice. Data are shown as mean± s.e.m. (tumor alone, n = 11; NR, n = 13; CR, n = 14; healthy donor, n = 8 for f and g). h, Peak CAR T cell counts in mice treated with CR (n = 8) or NR (n = 7) patient T cells (each symbol indicates one animal; boxes extend from the twenty-fifth to seventy-fifth percentiles; middle line, median; whiskers, minimum and maximum). i, Kaplan-Meier analysis of survival. P values were determined with two-tailed log-rank Mantel-Cox tests. The numbers of animals at risk in each group at specific time intervals are listed below the survival curve.
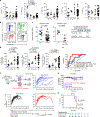
Fig. 2|
Fig. 2|. Transcriptional profiles of CAR T cellular products reveal T cell-intrinsic quality attributes associated with clinical response.
a, Genes differentially expressed in CTL019 cellular infusion products from patients with CLL. Each column depicts an individual sample, and each row represents an individual gene, shaded to indicate normalized expression. The top 200 genes in either direction are shown. b, RNA-sequencing results from CAR T cell infusion products, shown as a f-distributed stochastic neighbor embedding (f-SNE) visualization. Each point depicts data from an individual patient sample labeled according to clinical response. c, Heat map of selected pathways enriched in genes significantly upregulated or downregulated in CTL019 cells from CR (blue bar), PRTD (green bar), PR (red bar) and NR (black bar) patients. For each pathway, a single sample enrichment score was calculated, and the mean was taken per response group. A color gradient ranging from dark blue to dark red indicates the mean normalized enrichment score (ranging from −3 to+3) of pathways enriched in induced (red) or repressed (blue) genes. d, Enrichment of an early memory T cell differentiation signature in preinfusion CTL019 cells from patients with CLL, for different response categories. e-g, Gene signature sets for T cell memory compared with effector (e), glycolysis (f) and exhaustion (g), as assessed by single-sample enrichment analysis. In d-g, each point represents the relative enrichment of these signatures in individual patient T cellular product samples. Boxes indicate the twenty-fifth to seventy-fifth percentiles; middle line, median; whiskers, minimum and maximum. The normalized enrichment score for each gene set is plotted on the y axis. P values were calculated with two-tailed Welch’s f tests (c-g). For a-g, CR, n = 5; PRTD, n = 3; PR, n = 5; NR, n = 21.
Fig. 3|
Fig. 3|. CAR T cell replicative capacity, activation potential and IL-6/STAT3-pathway enrichment define therapeutic response and failure.
a, Ex vivo proliferation of CTL019 cells during clinical manufacturing, stratified according to clinical response (CR, n = 7; PRTD, n = 3; PR, n = 5; NR, n = 25). P values were calculated with two-tailed Mann-Whitney tests. b, Spearman’s rho correlation (two-tailed) between the ex vivo expansion potential and maximum in vivo proliferative capacity (measured by the cellular population doubling number) of adoptively transferred CTL019 cells in matched patients with CLL (n = 40). c, Comparison of telomere lengths between bulk, preinfused CTL019 cells in responding and nonresponding patients (CR, n = 8; PRTD, n = 3; PR, n = 5; NR, n = 20). Graphs in a and c show mean ± s.e.m. d, Single-sample enrichment analysis of T cell-activation gene signatures in the CTL019 gene expression profiles from CR/PRTD patients (n = 8; left) and PR and NR subjects (n = 26; middle) who received mock or CAR-specific stimulation. The rightmost panel depicts the magnitude of change in a T cell activation-associated gene-set score from mock- to CAR-stimulated CTL019 preinfusion cells from patients belonging to the respective response categories. P values were calculated with two-tailed paired t tests. e, Levels of soluble cytokines produced from CAR-stimulated CTL019 cells subtracted from baseline levels; matched, unstimulated controls in evaluable patient samples were used (CR, n = 6; PRTD, n = 3; PR, n = 5; NR, n = 21). P values were calculated with two-tailed Mann-Whitney tests. Graphs show mean with s.e.m. overlaid; symbols represent individual patient samples. f, Single-sample gene set enrichment analysis of the IL-6/STAT3 pathway in CAR-stimulated CTL019 cells from patients in each response group (P values were determined with two-tailed Welch’s t tests). Bars represent the mean ± s.e.m. g, Representative flow cytometry showing levels of pSTAT3 in preinfusion CTL019 cells from a CR and NR patient after overnight stimulation with isotype-control antibody-coated beads (mock stimulated) or beads coated with an anti-idiotypic antibody against CAR19 (CAR19 stimulated) (left). Pooled data from patients with highly functional (CR, n = 3; PRTD, n = 2) versus poorly functional (PR, n = 3; NR, n = 11) CAR T cells are shown in box plots (right). Boxes indicate the twenty-fifth to seventy-fifth percentiles; middle line, median; whiskers, minimum and maximum. Each symbol denotes an individual patient sample. The change in fluorescence intensity (ΔΜΡΙ) was calculated by subtracting the MFI of pSTAT3 in stimulated cells from that in unstimulated cells. The P value was calculated with a two-tailed Mann-Whitney test. h, Spearman’s rho correlation (two-tailed) shown between the maximum in vivo proliferative capacity of adoptively transferred CAR T cells (Cmax) and peak levels of serum IL-6 (n = 41; left) or IL-6/STAT3 gene enrichment in patient-matched CAR-stimulated (as above) CTL019 cells (n = 34; right).
Fig. 4|
Fig. 4|. The presence of mechanistically relevant T cell populations in patients can predict response to CTL019 therapy.
a, Frequencies of naive (TN), stem cell memory (TSCM), central memory (TCM), effector memory (TEM) and effector (TEFF) CD8+ T cells from patients in each response group (CR, n = 7; PRtd, n = 3; PR, n = 4; NR, n = 24) at the time of leukapheresis. b, Representative contour plots examining the proportions of CD45RO-CD27+CD8+ T cells from CR, PRtd, PR and NR CTL019 patients (3 independent experiments). c, Summary of leukapheresis CD27+CD45RO-CD8+ T cell frequencies in patients belonging to each response category in an original discovery cohort (left). A cutoff value of 28.6% (represented by the dashed lines) optimally segregated patients with highly functional (CR/PRtd; n = 10) or poorly functional (PR/NR; n = 28) CAR T cells (positive predictive value, 72.73%; negative predictive value, 92.59%). A CD45RO-CD27+CD8+ T cell frequency >28.6% segregated CR (n = 4) from non-CR (SD (stable disease) + PR; n = 4) patients with CLL in a validation cohort (middle). Clinical-response assessments for the validation cohort were conducted 3 months after CTL019 cell infusion and are based on tumor-burden status in the lymph nodes and spleen. Specificity and sensitivity measurements for each patient group are displayed in tabular form (right). d, Percentages of CD8+ T cells expressing PD-1 and coexpressing PD-1 and LAG-3 or TIM-3 in preinfusion CTL019 cells (CR, n = 6; PRtd, n = 3; PR, n = 5; NR, n = 21). For a, c and d, two-tailed Mann-Whitney tests were used for comparisons between groups. Graphs show mean and s.e.m. e, Receiver operating characteristic (ROC) curve for multiple biomarkers that define different T cell populations in the CAR T cellular product. ROC curves are based on the total dose (cells/kg) of CTL019 cells infused into CR (n = 6) versus NR patients (n = 21). AUC values, shown in parentheses, represent areas under the respective ROC curves and provide an overall measure of predictive power. f, Top, experimental setup, showing transfer of retrospective CR CAR T cell infusion products with (bulk) or without CD8+CD27+PD-1- lymphocytes (depleted) from patients with CLL into fully leukemic NSG mice (tumor alone, n = 20; bulk CTL019, n = 10; depleted CTL019, n = 12). Bottom, longitudinal tumor burden (BLI) of NALM-6-bearing mice treated with CAR T cells (each line indicates one mouse). g, Weight loss in mice, shown over time. h, Kaplan-Meier curves showing survival of mice. P values were calculated with twotailed log-rank Mantel-Cox tests. Numbers of mice at risk in each group at specific time points are listed below the survival curve.

Comment in

Similar articles

Cited by

References

    1. Makkouk A & Weiner GJ Cancer immunotherapy and breaking immune tolerance: new approaches to an old challenge. Cancer Res. 75, 5–10 (2015). - PMC - PubMed
    1. Vesely MD, Kershaw MH, Schreiber RD & Smyth MJ Natural innate and adaptive immunity to cancer. Annu. Rev. Immunol 29, 235–271 (2011). - PubMed
    1. Brown JR et al. Idelalisib, an inhibitor of phosphatidylinositol 3-kinase p110delta, for relapsed/refractory chronic lymphocytic leukemia. Blood 123, 3390–3397 (2014). - PMC - PubMed
    1. Jain P et al. Outcomes of patients with chronic lymphocytic leukemia after discontinuing ibrutinib. Blood 125, 2062–2067 (2015). - PMC - PubMed
    1. Kalos M et al. T cells with chimeric antigen receptors have potent antitumor effects and can establish memory in patients with advanced leukemia. Sci. Transl. Med 3, 95ra73 (2011). - PMC - PubMed

Publication types