The loss of the kinases SadA and SadB results in early neuronal apoptosis and a reduced number of progenitors
- PMID: 29698519
- PMCID: PMC5919486
- DOI: 10.1371/journal.pone.0196698
The loss of the kinases SadA and SadB results in early neuronal apoptosis and a reduced number of progenitors
Abstract
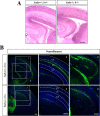
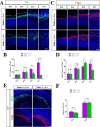
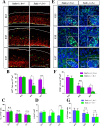
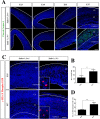
The neurons that form the mammalian neocortex originate from progenitor cells in the ventricular (VZ) and subventricular zone (SVZ). Newborn neurons are multipolar but become bipolar during their migration from the germinal layers to the cortical plate (CP) by forming a leading process and an axon that extends in the intermediate zone (IZ). Once they settle in the CP, neurons assume a highly polarized morphology with a single axon and multiple dendrites. The AMPK-related kinases SadA and SadB are intrinsic factors that are essential for axon formation during neuronal development downstream of Lkb1. The knockout of both genes encoding Sad kinases (Sada and Sadb) results not only in a loss of axons but also a decrease in the size of the cortical plate. The defect in axon formation has been linked to a function of Sad kinases in the regulation of microtubule binding proteins. However, the causes for the reduced size of the cortical plate in the Sada-/-;Sadb-/- knockout remain to be analyzed in detail. Here we show that neuronal cell death is increased and the number of neural progenitors is decreased in the Sada-/-;Sadb-/- CP. The reduced number of progenitors is a non-cell autonomous defect since they do not express Sad kinases. These defects are restricted to the neocortex while the hippocampus remains unaffected.
Conflict of interest statement
Figures


Similar articles
-
The balance of mitochondrial fission and fusion in cortical axons depends on the kinases SadA and SadB.Cell Rep. 2021 Dec 21;37(12):110141. doi: 10.1016/j.celrep.2021.110141. Cell Rep. 2021. PMID: 34936879
-
Persistence of the cell-cycle checkpoint kinase Wee1 in SadA- and SadB-deficient neurons disrupts neuronal polarity.J Cell Sci. 2010 Jan 15;123(Pt 2):286-94. doi: 10.1242/jcs.058230. Epub 2009 Dec 21. J Cell Sci. 2010. PMID: 20026642
-
Isozyme-Specific Role of SAD-A in Neuronal Migration During Development of Cerebral Cortex.Cereb Cortex. 2019 Aug 14;29(9):3738-3751. doi: 10.1093/cercor/bhy253. Cereb Cortex. 2019. PMID: 30307479 Free PMC article.
-
Molecules and mechanisms that regulate multipolar migration in the intermediate zone.Front Cell Neurosci. 2014 Nov 14;8:386. doi: 10.3389/fncel.2014.00386. eCollection 2014. Front Cell Neurosci. 2014. PMID: 25452716 Free PMC article. Review.
-
Exploring the Complexity of Cortical Development Using Single-Cell Transcriptomics.Front Neurosci. 2018 Feb 2;12:31. doi: 10.3389/fnins.2018.00031. eCollection 2018. Front Neurosci. 2018. PMID: 29456488 Free PMC article. Review.
Cited by
-
Deleterious Variation in BR Serine/Threonine Kinase 2 Classified a Subtype of Autism.Front Mol Neurosci. 2022 Jun 10;15:904935. doi: 10.3389/fnmol.2022.904935. eCollection 2022. Front Mol Neurosci. 2022. PMID: 35754711 Free PMC article.
-
An isoform-specific function of Cdc42 in regulating mammalian Exo70 during axon formation.Life Sci Alliance. 2022 Dec 21;6(3):e202201722. doi: 10.26508/lsa.202201722. Print 2023 Mar. Life Sci Alliance. 2022. PMID: 36543541 Free PMC article.
-
Case report: A novel frameshift mutation in BRSK2 causes autism in a 16-year old Chinese boy.Front Psychiatry. 2023 Aug 21;14:1205204. doi: 10.3389/fpsyt.2023.1205204. eCollection 2023. Front Psychiatry. 2023. PMID: 37671287 Free PMC article.
-
Dynamic Regulation of brsk2 in the Social and Motor Development of Zebrafish: A Developmental Behavior Analysis.Int J Mol Sci. 2023 Nov 19;24(22):16506. doi: 10.3390/ijms242216506. Int J Mol Sci. 2023. PMID: 38003696 Free PMC article.
-
Brain-specific serine/threonine-protein kinase 1 is a substrate of protein kinase C epsilon involved in sex-specific ethanol and anxiety phenotypes.Addict Biol. 2024 Mar;29(3):e13388. doi: 10.1111/adb.13388. Addict Biol. 2024. PMID: 38497285 Free PMC article.
References
-
- Florio M., and Huttner W.B. (2014). Neural progenitors, neurogenesis and the evolution of the neocortex. Development 141, 2182–2194. doi: 10.1242/dev.090571 - DOI - PubMed
-
- Noctor S.C., Martinez-Cerdeno V., Ivic L., and Kriegstein A.R. (2004). Cortical neurons arise in symmetric and asymmetric division zones and migrate through specific phases. Nat Neurosci 7, 136–144. doi: 10.1038/nn1172 - DOI - PubMed
-
- Sakakibara A., and Hatanaka Y. (2015). Neuronal polarization in the developing cerebral cortex. Front Neurosci 9, 116 doi: 10.3389/fnins.2015.00116 - DOI - PMC - PubMed
-
- Funahashi Y., Namba T., Nakamuta S., and Kaibuchi K. (2014). Neuronal polarization in vivo: Growing in a complex environment. Curr Opin Neurobiol 27, 215–223. doi: 10.1016/j.conb.2014.04.009 - DOI - PubMed
-
- Namba T., Funahashi Y., Nakamuta S., Xu C., Takano T., and Kaibuchi K. (2015). Extracellular and Intracellular Signaling for Neuronal Polarity. Physiol Rev 95, 995–1024. doi: 10.1152/physrev.00025.2014 - DOI - PubMed
Publication types
MeSH terms
Substances
Grants and funding
LinkOut - more resources
Full Text Sources
Other Literature Sources
Molecular Biology Databases
Miscellaneous

