. 2018 May 1;9(5):476.
doi: 10.1038/s41419-018-0469-1.

Lysosomal damage after spinal cord injury causes accumulation of RIPK1 and RIPK3 proteins and potentiation of necroptosis

Affiliations

Lysosomal damage after spinal cord injury causes accumulation of RIPK1 and RIPK3 proteins and potentiation of necroptosis

Shuo Liu et al. Cell Death Dis. .

Abstract

Necroptosis, a regulated necrosis pathway mediated by the receptor-interacting protein kinases 1 and 3 (RIPK1 and RIPK3), is induced following spinal cord injury (SCI) and thought to contribute to neuronal and glial cell death. However, mechanisms leading to activation of necroptosis after SCI remain unclear. We have previously shown that autophagy, a catabolic pathway facilitating degradation of cytoplasmic proteins and organelles in a lysosome-dependent manner, is inhibited following SCI in rats. Our current data confirm that inhibition of autophagy also occurs after thoracic contusive SCI in the mouse model, as indicated by accumulation of both the autophagosome marker, LC3-II and autophagy cargo protein, p62/SQSTM1. This was most pronounced in the ventral horn neurons and was caused by rapid inhibition of lysosomal function after SCI. Interestingly, RIPK1, RIPK3, and the necroptosis effector protein MLKL also rapidly accumulated after SCI and localized to neurons with disrupted autophagy, suggesting that these events may be related. To determine if lysosomal dysfunction could contribute to induction of necroptosis, we treated PC12 cells and primary rat cortical neurons with lysosomal inhibitors. This led to rapid accumulation of RIPK1 and RIPK3, confirming that they are normally degraded by the lysosomal pathway. In PC12 cells lysosomal inhibition also sensitized cells to necroptosis induced by tumor necrosis factor α (TNFα) and caspase inhibitor. Imaging studies confirmed that RIPK1 partially localized to lysosomes in both untreated and lysosomal inhibitor treated cells. Similarly, we detected presence of RIPK1, RIPK3 and MLKL in both cytosol and at lysosomes after SCI in vivo. Furthermore, stimulation of autophagy and lysosomal function with rapamycin treatment led to decreased accumulation of RIPK1 and attenuated cell death after SCI. These data suggest that lysosomal dysfunction after SCI may contribute to both inhibition of autophagy and sensitize cells to necroptosis by promoting RIPK1 and RIPK3 accumulation.


Conflict of interest statement

The authors declare that they have no conflict of interest.

Figures
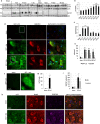
Fig. 1
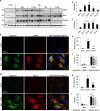
Fig. 1. SCI leads to disruption of autophagy flux in ventral horn motor neurons.
a Time course of accumulation of LC3-II and p62/SQSTM1 proteins in the spinal cord tissue surrounding injury site following thoracic contusion SCI in a mouse model. Each blot lane represents an individual animal. Full unedited western blots are presented in Supplemental Figure S1a. b Quantification of LC3-II levels from a and S1a. c Quantification of p62/SQSTM1 levels from a and S1a. n = 5. d IHC staining demonstrating accumulation of the GFP-LC3 autophagosome marker and p62/SQSTM1 in the same ventral horn cells 24 h after SCI in GFP-LC3 transgenic autophagy reporter mice. Images were acquired at 60 × magnification. Images for day 3 and 7 are presented in Supplemental Figure S2. e Quantification of GFP-LC3 and SQSTM1 data in d and S2a. n = 4. f Close-up of GFP-LC3 images from areas indicated in d showing accumulation of autophagosomes. g Quantification of autophagosomes/autophagic vesicles (AV) from data in d and f. n = 4 . h IHC images demonstrating that GFP-LC3 and p62/SQSTM1 accumulate primarily in neurons in the ventral horn at day 1 after SCI. Neurons were identified by staining with NeuN/RBFOX3. Images were acquired at ×20 magnification. i Quantification of data from h. n = 4 All data are presented as mean±SE. *p < 0.05, **p < 0.01, ***p < 0.001
Fig. 2
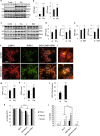
Fig. 2. SCI leads to rapid lysosomal dysfunction in the spinal cord.
a Time course of CTSD protein expression in spinal cord tissue surrounding injury site following SCI in mice. Full unedited western blots are presented in Supplemental Figure S1b. b Quantification of total CTSD data from a and S1b. n = 5. c Expression of CTSD in the lysosomes after SCI in mouse spinal cord. Sham and SCI mouse spinal cord tissue was fractionated to isolate lysosome-enriched fraction, then processed for western blot. Both full length precursor and cleaved active CTSD are indicated. Lysosomal membrane protein LAMP1 was used to identify lysosomal fraction and as a loading control. The exposure time is much longer than in panel a to allow better visualization of CTSD levels. Full unedited blots are presented in Supplemental Figure S3a. d Quantification of precursor and cleaved CTSD data from c. n = 6. e, f Activity of lysosomal enzymes CTSD and NAG was assessed in the spinal cord tissue surrounding injury site at 6 h (e) or 24 h (f) after SCI in mice. n = 6. All data are presented as mean±SE. *p < 0.05, **p < 0.01, ***p < 0.001
Fig. 3
Fig. 3. Expression of the necroptosis regulator RIPK1 correlates with inhibition of autophagy and lysosomal function after SCI.
a The time course of RIPK1 protein expression in spinal cord tissue surrounding injury site following SCI in mice. Full unedited western blots are presented in Supplemental Figure S1c. b Quantification of RIPK1 data from a and S1c. n = 5. c IHC staining demonstrates accumulation of RIPK1 and p62/SQSTM1 in the same ventral horn cells at 24 h after SCI in mice. Images were acquired at ×20 magnification. Full time course images for RIPK1 are presented in Supplemental Figure S4a. d Quantification of RIPK1 data in c and S4a. n = 3–5. e Quantification of RIPK1 and SQSTM1 data in c. At day 1 after SCI 47.8% of RIPK1 positive cells were also positive for p62/SQSTM1. n = 8–13. All data are presented as mean±SE. *p < 0.05, **p < 0.01, ***p < 0.001
Fig. 4
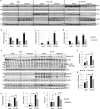
Fig. 4. Expression of the downstream necroptosis mediators RIPK3 and MLKL correlates with inhibition of autophagy and lysosomal function after SCI.
a The time course of RIPK3 and MLKL protein expression in spinal cord tissue surrounding injury site following SCI in mice. Full unedited western blots are presented in Supplemental Figure S5. b Quantification of RIPK3 data from a. c Quantification of MLKL data from a. n = 4. d IHC staining demonstrates accumulation of RIPK3 and p62/SQSTM1 in the same ventral horn cells at 24 h after SCI in mice. Images were acquired at ×20 magnification. Full time course images for RIPK3 are presented in Supplemental Figure S4b. e Quantification of RIPK3 data in d and S4b. n = 4. f Quantification of RIPK3 and SQSTM1 data in d. At day 1 after SCI 78.2% of RIPK3 positive cells were also positive for p62/SQSTM1. n = 12–17. g IHC staining demonstrates accumulation of MLKL and p62/SQSTM1 in the same ventral horn cells at 24 h after SCI in mice. Full time course images for MLKL are presented in Supplemental Figure S4c. h Quantification of MLKL data in g and S4c. n = 4. i Quantification of MLKL and SQSTM1 data in g. At day 1 after SCI 69.4% of MLKL positive cells were also positive for p62/SQSTM1. n = 10–12. All data are presented as mean±SE. *p < 0.05, **p < 0.01, ***p < 0.001
Fig. 5
Fig. 5. Lysosomal inhibition leads to accumulation of necroptosis mediators and sensitization to necroptosis in vitro.
a Accumulation of RIPK1 and RIPK3 in PC12 cells following treatment with lysosomal inhibitor chloroquine (Chq, 100 μM). Cells were treated for 4 h. Full unedited western blots are presented in Supplemental Figure S6a-b. b Quantification of RIPK1 and RIPK3+/− Chq treatment data from a. n = 14–20. c Accumulation of RIPK1 and RIPK3 in rat cortical neurons following treatment with Chq or Bafilomycin A (BafA, 100 nM). Cells were treated for 4 h. Full unedited western blots are presented in Supplemental Figure S6d. d Quantification of RIPK1 and RIPK3+/− Chq treatment data from c. n = 12. e Quantification of RIPK1 and RIPK3+/− BafA treatment data from c. n = 8. f IF staining for RIPK1 in control and Chq treated rat cortical neurons. Cells were treated for 4 h; LAMP1 was used to visualize lysosomes. Images were acquired at ×20. g Quantification of RIPK1 intensity from f. n = 12. h Quantification of RIPK3 intensity in rat cortical neurons with and without Chq treatment. n = 8–9 Representative images are in Supplemental Figure S6e. i Close-up of the areas indicated in f showing colocalization of LAMP1 and RIPK1. Arrows point to RIPK1 positive lysosomes. j Quantification of RIPK1 positive lysosomes from i. n = 12. k Potentiation of necroptosis in PC12 cells treated with lysosomal inhibitor BafA. PC12 cells were treated with cycloheximide (20 μg/ml), pan-caspase inhibitor Boc-D (50 μM), and indicated doses of rat TNFα (0, 25, 50 ng/ml) to induce necroptosis in the presence or absence of BafA (100 nM). RIPK1 inhibitor necrostatin 1 (Nec1, 30 μM) was used to confirm that cell death was dependent on necroptosis. After 18 h cell viability was measured using luminescent ATP assay. n = 6 Additional controls are presented Supplemental Figure S7. l Data from k presented as % cell death. All data are presented as mean ± SD. *p < 0.05, **p < 0.01, ***p < 0.001
Fig. 6
Fig. 6. Lysosomal degradation contributes to regulation of necroptosis in vivo after SCI.
a Expression of RIPK1, RIPK3, and MLKL in the cytosol and at the lysosomes in mouse spinal cord. Sham and SCI mouse spinal cord tissue was fractionated to isolate cytosolic and lysosome-enriched fractions. Lysosomal membrane protein LAMP1 was used to identify lysosomal fraction and as a loading control. Full unedited western blots are presented in Supplemental Figure S3b. b Quantification of RIPK1 data from a and S3b. c Quantification of RIPK3 data from a and S3b. d Quantification of MLKL data from a and S3b. n = 6. e Western blot data demonstrating that induction of autophagy and lysosomal function with Rapamycin decreased accumulation of RIPK1 and attenuated cell death in the mouse spinal cord tissue surrounding injury site at 24 h after SCI. Full unedited western blots are presented in Supplemental Figure S8a–c. f Quantification of phospho-S6 from e demonstrating inhibition of mTOR activity by Rapamycin after SCI. g Quantification of cleaved (145–150 kDa) α-fodrin from e. h Quantification of p62/SQSTM1 levels from e. i Quantification of RIPK1 levels from e. j Quantification of MLKL levels from e. n = 6. All data are presented as mean±SE. *p < 0.05, **p < 0.01, ***p < 0.001

Similar articles

Cited by

References

    1. Beattie MS, Hermann GE, Rogers RC, Bresnahan JC. Cell death in models of spinal cord injury. Prog. Brain Res. 2002;137:37–47. doi: 10.1016/S0079-6123(02)37006-7. - DOI - PubMed
    1. Faden AI, Stoica B. Neuroprotection: challenges and opportunities. Arch. Neurol. 2007;64:794–800. doi: 10.1001/archneur.64.6.794. - DOI - PubMed
    1. Degterev A, et al. Chemical inhibitor of non-apoptotic cell death with therapeutic potential for ischemic brain injury. Nat. Chem. Biol. 2005;1:112–119. doi: 10.1038/nchembio711. - DOI - PubMed
    1. Vandenabeele P, Galluzzi L, Vanden Berghe T, Kroemer G. Molecular mechanisms of necroptosis: an ordered cellular explosion. Nat. Rev. Mol. Cell Biol. 2010;11:700–714. doi: 10.1038/nrm2970. - DOI - PubMed
    1. Ofengeim D, Yuan J. Regulation of RIP1 kinase signalling at the crossroads of inflammation and cell death. Nat. Rev. Mol. Cell Biol. 2013;14:727–736. doi: 10.1038/nrm3683. - DOI - PubMed

Publication types

MeSH terms

Substances