. 2018 May 2;98(3):547-561.e10.
doi: 10.1016/j.neuron.2018.03.043. Epub 2018 Apr 19.

CALHM3 Is Essential for Rapid Ion Channel-Mediated Purinergic Neurotransmission of GPCR-Mediated Tastes

Affiliations

CALHM3 Is Essential for Rapid Ion Channel-Mediated Purinergic Neurotransmission of GPCR-Mediated Tastes

Zhongming Ma et al. Neuron. .

Abstract

Binding of sweet, umami, and bitter tastants to G protein-coupled receptors (GPCRs) in apical membranes of type II taste bud cells (TBCs) triggers action potentials that activate a voltage-gated nonselective ion channel to release ATP to gustatory nerves mediating taste perception. Although calcium homeostasis modulator 1 (CALHM1) is necessary for ATP release, the molecular identification of the channel complex that provides the conductive ATP-release mechanism suitable for action potential-dependent neurotransmission remains to be determined. Here we show that CALHM3 interacts with CALHM1 as a pore-forming subunit in a CALHM1/CALHM3 hexameric channel, endowing it with fast voltage-activated gating identical to that of the ATP-release channel in vivo. Calhm3 is co-expressed with Calhm1 exclusively in type II TBCs, and its genetic deletion abolishes taste-evoked ATP release from taste buds and GPCR-mediated taste perception. Thus, CALHM3, together with CALHM1, is essential to form the fast voltage-gated ATP-release channel in type II TBCs required for GPCR-mediated tastes.

Keywords: ATP release; blue-native page; concatemer; hexamer; knockout; mouse; patch-clamp electrophysiology; single-molecule photobleaching; taste bud; voltage-gated.


Figures

Figure 1
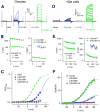
Figure 1. CALHM3 Enhances Voltage-dependent Gating of CALHM1 Channels
(A-C) Biophysical features of CALHM currents in Xenopus oocytes. (A) Representative families of currents in control Xenopus oocytes (ASO) and oocytes expressing mouse CALHM1, CALHM3 or both (CALHM1+3), evoked by 5-s voltage pulses from -80 mV to +70 mV in 10-mV increments from holding potential of -40 mV every 30 s. Dashed line: zero-current level. (B) Activation time constants: left, fast (τfast) and slow (τslow) components of CALHM1+3 currents (n =19), obtained by fitting outward currents with a double exponential function; right, τ of CALHM1 currents (n = 13), obtained by fitting with a single exponential function, compared with τslow of CALHM1+3 currents. (C) Conductance-voltage (G-V) relations. See METHODS for normalization procedures. Solid lines: Boltzmann function fits with V0.5 and Z0: +77.6 ± 3.2 mV, 1.3 ± 0.1 e for CALHM1 (n = 13); +30.5 ± 1.9 mV, 1.4 ± 0.1 e for CALHM1+3 (n = 27). Mean ± s.e.m., two-tailed unpaired Student's t-test: P = 8.56E-16, t38 = 13.225 for V0.5; P = 0.154, t38 = 1.454 for Z0. (D-F) Similar to (A-C), in N2a cells. (D) Representative families of currents in N2a cells expressing mouse CALHM1, CALHM3 or both or neither, evoked by 500-ms voltage pulses from -80 mV to +150 mV in 10-mV increments from holding potential of -40 mV every 10 s. (E) Activation time constants: left, τfast and τslow for currents in N2a cells co-expressing CALHM1+3 (n = 22) obtained by a double exponential fit; right, activation time constants for CALHM1 currents (n = 14) obtained by single exponential fitting, compared with τslow of CALHM1+3 currents. The activation time constants obtained from oocytes and N2a cells were different due to different duration of the depolarizing pulses and the slow voltage-clamp and larger capacitance of oocytes. (F) G-V relations obtained by measurement of inward currents at -80 mV evoked by 500-ms voltage pre-pulses, normalized to individual whole-cell capacitance. Whole-cell capacitances were not different (vector: 14.6 ± 1.2 pF, n = 14; CALHM1: 12.7 ± 0.7 pF, n =14; CALHM3: 14.3 ± 1.4 pF, n = 12; CALHM1+3: 13.7 ± 0.6 pF, n = 22 (Two-tailed unpaired Student's t-test: CALHM1, P = 0.163, t26 = 1.436; CALHM3: P = 0.872, t24 = 0.162; CALHM1+3, P = 0.469, t34 = 0.733). Solid lines: Boltzmann function fits with V0.5 and Z0: +148.8 ± 6.4 mV, 0.78 ± 0.06 e for CALHM1 (n=14); +79.5 ± 4.2 mV, 0.84 ± 0.03 e for CALHM1+3 (n = 22). (Two-tailed unpaired Student's t-test: P = 2.259E-11, t34 = 9.744 for V0.5; P = 0.365, t34 = 0.918 for Z0). The G-V relations of CALHM1+CALHM3 from Xenopus oocytes and N2a cells were different due to different depolarizing voltage-ranges, from -80 mV to +70 mV in oocytes and -80 mV to + 150 mV in N2a cells, respectively. See also Figures S1 and S2.
Figure 2
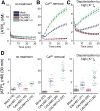
Figure 2. CALHM3 Accelerates CALHM1-mediated ATP Release
(A-C) Time courses of extracellular-ATP levels due to release from mock-, CALHM1-, CALHM3- and CALHM1+3-transfected HeLa cells exposed to normal (1.9 mM; A) or essentially zero (17 nM; B) Ca2+o or to depolarization by exposure to high [K+]o (117.5 mM; C) (D) Summary of total release over 30 min. Number of wells shown in parenthesis. Mean ± s.e.m. Statistical differences were calculated by one-way ANOVA (F(3,60)=41.74, p = 1.069E-14 for no treatment; F(3, 87) = 163.51, P = 1.207E-35 for Ca2+o removal; F(3,118)=81.37, p = 1.339E-28 for high [K+]o) with Bonferroni post-hoc test. *P < 0.0083; n.s., not significant. Exact P values of Mock vs CALHM1, Mock vs CALHM3, Mock vs CALHM1+3, and CALHM1 vs CALHM1+3 are respectively 5.4645E-10, 0.6969, 3.0590E-12, and 0.1912 for no treatment; 1.0156E-14, 0.8178, 3.5725E-33, and 2.7564E-16 for Ca2+o removal; and 2.0393E-6, 0.7282, 1.6021E-25, and 1.2008E-13 for high [K+]o. See also Figure S3.
Figure 3
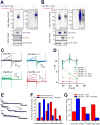
Figure 3. CALHM3 Co-localizes and Interacts with CALHM1
(A) Epitope-tagged CALHM1 and CALHM3 co-localize in N2a cells transfected with CALHM1-GFP and CALHM3-FLAG (1:1 ratio), in absence and presence of cycloheximide (CHX; to minimize intracellular CALHM). DAPI was used as nuclear counterstain. (B) CALHM3 co-immunoprecipitates with itself and with CALHM1. Left: CALHM3 physically interacts with CALHM3. N2a cells were transfected with CALHM3-GFP and/or CALHM3-FLAG. Right: CALHM3 physically interacts with CALHM1. N2a cells transfected with CALHM1-GFP and/or CALHM3-FLAG as indicated. Epitope-tagged CALHM proteins were immunoprecipitated 24 h after transfection and analyzed by western blotting. Input: whole-cell lysate; IP, immunoprecipitated sample. (C) PM localization of CALHM1 is promoted by co-expression of CALHM3. Biotin immunoreactivity and DAPI were used as PM marker and nuclear counterstain, respectively. (D) Cell surface proteins were biotinylated and pulled down with streptavidin beads. CALHM in whole-cell lysates (Input) and biotinylated-protein samples (Surface) detected by immunoblotting using anti-tag antibodies. Na+/K+-ATPase and β-tubulin were used as markers of PM and cytoplasm, respectively. (E-G) Levels of CALHM proteins in PM (E), total cells (F), and the ratio of PM to total cells (G). CALHM proteins in PM fraction and whole cell lysates detected as in (D) were measured and normalized by the amounts of Na+/K+-ATPase (E, G) and β-tubulin (F, G). Data shown as fold-change caused by co-expression of other isoform. Surface/total expression ratios of CALHM1 and CALHM3 were both increased by co-expression of other isoform. Mean ± s.e.m.; *P < 0.05 (one sample t-test); n=7. P values for CALHM1 and CALHM3 are respectively 0.053 (t6 = 2.410) and 0.168 (t6 = 1.566) in (E); 0.359 (t6 = 0.994) and 0.002 (t6 = 5.099) in (F); 0.034 (t6 = 2.766) and 0.012, t6 = 3.547 (G). See also Figure S4.
Figure 4
Figure 4. CALHM3 and CALHM1 Exist in a Single Hexameric Channel Complex
(A) BN-PAGE analysis of CALHM1-FLAG and CALHM1-GFP in N2a cell lysates 24 h after transfection. Molecular-weight shift between CALHM1-FLAG and CALHM1-GFP complexes is in agreement with a CALHM1 homo-hexamer. (B) CALHM3 is incorporated into the same protein complex with CALHM1 in lysates from N2a cells transfected 24 hrs earlier with CALHM1-FLAG and/or CALHM3-GFP. Whole-cell lysates analyzed by BN-PAGE (upper) and SDS-PAGE (lower). Co-expression of CALHM3-GFP slowed migration of the CALHM1-FLAG-associated complex (upper left panel). (C) Representative families of whole-cell currents from Xenopus oocytes expressing CALHM-1-1, CALHM-3-1, CALHM-1-1-1 and CALHM-1-3-1 concatemers, evoked by 5-s voltage pulses every 30 s from -80 mV to +60 mV in 20-mV increments from a holding potential of -40 mV in bath containing 1.5 mM Ca2+ and 1 mM Mg2+. Dashed lines: zero-current level. (D) Activation time constants obtained from a single-exponential function for CALHM-1-1 (n = 8), CALHM-3-1 (n = 5) and CALHM-1-1-1 (n = 10) currents, and from a double-exponential function for CALHM-1-3-1 currents (n = 8). (E) Representative examples of single molecule bleaching records obtained from Xenopus oocytes expressing CALHM3-mCherry alone. (F) Distribution of number of bleaching steps observed from CALHM3-mCherry expressing oocytes co-expressing (188 particles) or not (149 particles) untagged-CALHM1. (G) Distribution of number of bleaching steps observed from CALHM1-CALHM1-GFP concatemers co-expressing (179 spots) or not (219 spots) untagged-CALHM3. See also Figure S5.
Figure 5
Figure 5. CALHM3 is an Essential Component of the Voltage-gated Non-selective ATP-release Channel in Type II TBCs
(A) Representative families of whole-cell currents from WT, Calhm1–/– and Calhm3–/– type II TBCs, evoked by 500-ms voltage pulses from -80 mV to +150 mV in 10-mV increments from a holding potential of -40 mV. Dashed line: zero-current level. Non-selective voltage-gated currents are abolished in cells lacking either CALHM1 or CALHM3. Residual currents previously observed in Calhm1–/– type II TBC (Taruno et al., 2013) were non-specific leak currents likely caused by longer voltage pulses (1 s) used. (B) G-V relations obtained by whole-cell capacitance-normalized currents at -80 mV evoked by 500-ms voltage pre-pulses. Solid line represents a Boltzmann function fit to WT data (V0.5 +78.0 ± 8.3 mV, Z0 0.88 ± 0.04 e, n = 21). Cell capacitance: 5.0 ± 0.4 pF (n = 21), 4.7 ± 0.7 pF (n = 10) and 4.9 ± 0.3 (n =20) for WT, Calhm1–/– and Calhm3–/– cells, respectively. Whole-cell capacitances are not different (two-tailed Student's unpaired t-test: Calhm1–/– versus WT, P = 0.633, t29 = 0.841; Calhm3–/– versus WT, P = 0.226, t39 = 0.226. (C) Representative families of normalized outward currents from a WT type II TBC and a N2a cell co-expressing CALHM1+CALHM3, evoked by 500-ms voltage pulses from -80 mV to +120 mV in 10-mV increments from a holding potential of -40 mV. Dashed line: zero-current level. (D) Activation-time constants τfast (lower panel) and τslow (upper panel) obtained from double-exponential fits to activation currents of WT type II TBC (n = 21) and N2a cells co-expressing CALHM1+CALHM3 (n = 22), respectively. Heterologous expression of CALHM1 with CALHM3 in N2a cells generated currents with voltage-dependent kinetic features identical to those of type II TBCs. Mean ± s.e.m. (E) Carbenoxolone (CBX) inhibits non-selective voltage-gated currents in type II TBC (n = 9) (top) and CALHM1+3 currents in N2a cells (n = 14) (bottom). Representative families of whole-cell currents in a WT type II TBC before, after perfusion of 10 μM CBX in bath solution for ∼10 min, and after 5-min wash-out by normal bath solution, evoked by 500-ms voltage pulses from -80 mV to +100 mV in 10-mV increments from a holding potential of -40 mV. Dashed line: zero-current level. Representative families of whole-cell currents in a N2a cell co-expressing CALHM1+CALHM3 before, after perfusion with10 μM CBX for ∼10 min, and 5 min after wash-out by the normal bath solution, evoked by 500-ms voltage pulses from -80 mV to +130 mV in 10-mV increments from a holding potential of -40 mV. Dashed line: zero-current level. See also Figures S6 and S7.
Figure 6
Figure 6. Type II TBC [Ca2+]i Signaling is Normal Whereas ATP Release is Abolished in Calhm1–/– and Calhm3–/– Mice
(A,B) [Ca2+]i signaling is normal in type II TBC from Calhm1–/– and Calhm3–/– mice. (A) Representative fura-2 fluorescence ratios in single GFP-positive (type II) (upper traces) and GFP-negative (lower traces) cells in response to 3-min exposure to a cocktail of bitter and sweet compounds in WT, Calhm1–/– and Calhm3–/– mice. (B) Summary of fura-2 ratio responses for WT (n = 22, 4 experiments), Calhm1–/– (n = 16, 6 experiments) and Calhm3–/– (n = 18, 5 experiments) type II cells. No differences observed among genotypes (two-tailed Student's unpaired t-test, Calhm1–/– versus WT: P = 0.944, t36 = 0.071; P = 0.547, t36 = 0.607; P = 0.367, t36 = 0.915 and Calhm3–/– versus WT: P = 0.432, t38 = 0.794; P = 0.930, t38 = 0.088; P = 0.509, t38 = 0.667, for peak, basal and plateau Ca2+ signaling, respectively). The basal [Ca2+]i were calibrated as 97 ± 25 nM, 102 ± 7 nM and 87 ± 18 nM for WT, Calhm1–/– and Calhm3–/– mice, respectively. Data presented as mean ± s.e.m.; *P < 0.01, **P < 0.001, ***P < 0.0001. (C) Tastant cocktail- and bath solution-evoked ATP release from gustatory CVP tissue and non-gustatory lingual epithelium (LE). Bitter/sweet taste mixture elicits marked ATP release from CVP versus LE in WT mice (n = 10; two-tailed Student's unpaired t-test, P = 0.0000003, t18 = 8.073). This is abolished in both Calhm3–/– (n = 5) and Calhm1–/– (n = 5) mice (two-tailed Student's unpaired t-test, Calhm3–/– versus WT: P = 0.00023, t13 = 5.023; Calhm1–/– versus WT, P = 0.00068, t13 = 4.433). ATP was significantly released from CVP tissue by bitter/sweet taste-mixture stimulation (n = 10, WT) compared with response to bath solution (n = 20, including Calhm1–/– and Calhm3–/– ; two-tailed Student's unpaired t-test, P = 0.000000001, t28 = 8.153, **P <0.01; ** P <0.001.
Figure 7
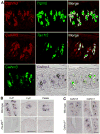
Figure 7. Calhm3 is Selectively Expressed in Type II TBCs
(A-C) Double-label in situ hybridization of Calhm3 in gustatory tissues. Calhm3 mRNA is expressed in a subset of TBC of circumvallate (CvP) and fungiform (FuP) papillae and palate but is absent in taste buds of Pou2f3–/– mice lacking type II cells. (A) Fluorescence and immunohistochemical double-label in situ hybridization directly illustrates cellular co-expression of Calhm3 and Trpm5 in CvP taste buds. Calhm3 expression is absent from Trpm5-negative cells. Tas1r3 is expressed in a subset of Calhm3-expressing CvP TBCs. Calhm3 is expressed in the same cells that express Calhm1. (B) Calhm3 mRNA expressed in a subset of cells in taste buds of circumvallate (CvP) and fungiform (FuP) papillae and palate of WT mice is absent in taste buds of Pou2f3–/– mice lacking type II cells. (C) In CvP taste bud cells from Calhm3–/– mice, Calhm3 expression is absent, whereas Calhm1 expression is normal. Scale bar, 50 μm. See also Figure S8.
Figure 8
Figure 8. CALHM3 is essential for GPCR-mediated taste perception
(A-C) Wild-type and Calhm3–/– mice preference scores during 48-h two-bottle choice tests (A) and lick rates during 5-sec brief-access tests relative to licking when water was presented (B), and chorda tympani nerve responses to sweet, umami, bitter, sour, and salty taste stimuli (C). Symbols depict means ± s.e.m. (n = 6 – 19 mice per group; see METHODS); *P < 0.05 (post hoc LSD or Tukey-Kramer tests). Chorda tympani nerve responses to NaCl were examined in the presence of 100 μM amiloride to expose activation of ENaC-insensitive salt transduction at high concentrations. See also Figure S8 and Table S1.

Comment in

Similar articles

Cited by

References

    1. Chaudhari N. Synaptic communication and signal processing among sensory cells in taste buds. J Physiol. 2014;592:3387–3392. - PMC - PubMed
    1. Cisneros-Mejorado A, Gottlieb M, Ruiz A, Chara JC, Perez-Samartin A, Marambaud P, Matute C. Blockade and knock-out of CALHM1 channels attenuate ischemic brain damage. J Cereb Blood Flow Metab. 2017 271678X17713587. - PMC - PubMed
    1. Clapp TR, Medler KF, Damak S, Margolskee RF, Kinnamon SC. Mouse taste cells with G protein-coupled taste receptors lack voltage-gated calcium channels and SNAP-25. BMC Biol. 2006;4:7. - PMC - PubMed
    1. Clapp TR, Yang R, Stoick CL, Kinnamon SC, Kinnamon JC. Morphologic characterization of rat taste receptor cells that express components of the phospholipase C signaling pathway. J Comp Neurol. 2004;468:311–321. - PubMed
    1. Dando R, Roper SD. Cell-to-cell communication in intact taste buds through ATP signalling from pannexin 1 gap junction hemichannels. J Physiol. 2009;587:5899–5906. - PMC - PubMed

Publication types