

Madagascar ground gecko genome analysis characterizes asymmetric fates of duplicated genes
- PMID: 29661185
- PMCID: PMC5901865
- DOI: 10.1186/s12915-018-0509-4
Madagascar ground gecko genome analysis characterizes asymmetric fates of duplicated genes
Abstract
Background: Conventionally, comparison among amniotes - birds, mammals, and reptiles - has often been approached through analyses of mammals and, for comparison, birds. However, birds are morphologically and physiologically derived and, moreover, some parts of their genomes are recognized as difficult to sequence and/or assemble and are thus missing in genome assemblies. Therefore, sequencing the genomes of reptiles would aid comparative studies on amniotes by providing more comprehensive coverage to help understand the molecular mechanisms underpinning evolutionary changes.
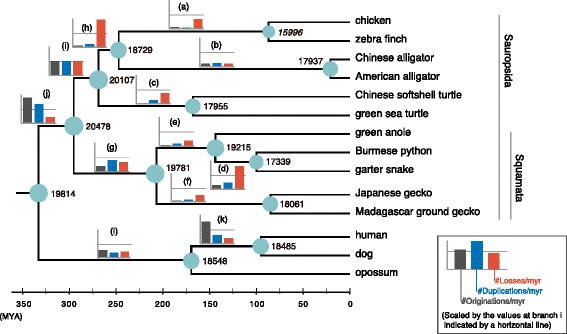
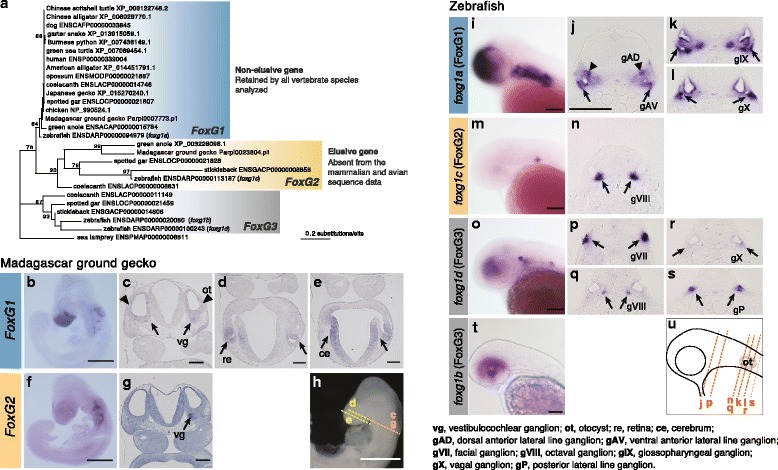
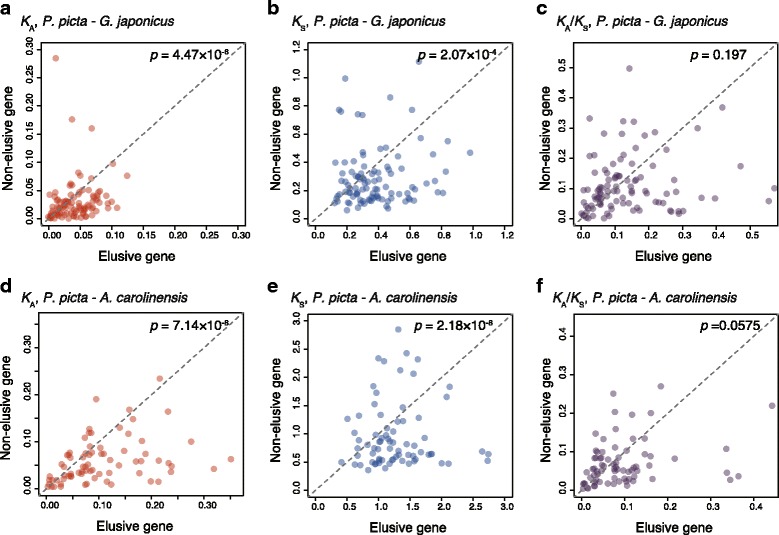
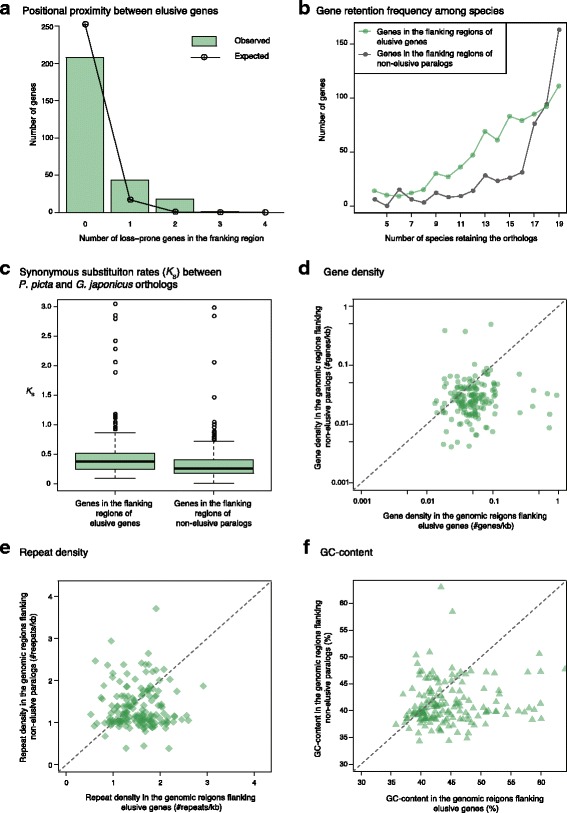
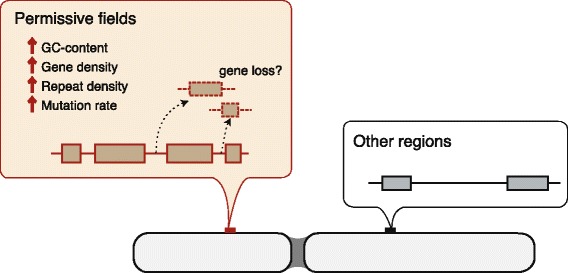
Results: Herein, we present the whole genome sequences of the Madagascar ground gecko (Paroedura picta), a promising study system especially in developmental biology, and used it to identify changes in gene repertoire across amniotes. The genome-wide analysis of the Madagascar ground gecko allowed us to reconstruct a comprehensive set of gene phylogenies comprising 13,043 ortholog groups from diverse amniotes. Our study revealed 469 genes retained by some reptiles but absent from available genome-wide sequence data of both mammals and birds. Importantly, these genes, herein collectively designated as 'elusive' genes, exhibited high nucleotide substitution rates and uneven intra-genomic distribution. Furthermore, the genomic regions flanking these elusive genes exhibited distinct characteristics that tended to be associated with increased gene density, repeat element density, and GC content.
Conclusion: This highly continuous and nearly complete genome assembly of the Madagascar ground gecko will facilitate the use of this species as an experimental animal in diverse fields of biology. Gene repertoire comparisons across amniotes further demonstrated that the fate of a duplicated gene can be affected by the intrinsic properties of its genomic location, which can persist for hundreds of millions of years.
Keywords: disparity of genomic fields; gecko; gene duplication; gene loss; gene repertoire evolution; phylome.
Conflict of interest statement
Ethics approval and consent to participate
All experiments and housing using the Madagascar ground gecko were conducted in accordance with guidelines approved by the RIKEN Animal Experiments Committee (Approval IDs AH25–05-1 and AH24–04–6). The experiments using zebrafish were approved by the Nagoya University animal experiment committee (Approval No. 2016022203).
Consent for publication
Not applicable.
Competing interests
The authors declare that they have no competing interests.
Publisher’s Note
Springer Nature remains neutral with regard to jurisdictional claims in published maps and institutional affiliations.
Figures

Similar articles
-
The complete mitochondrial genome of the Madagascar ground gecko Paroedura picta (Squamata: Gekkonidae).Mitochondrial DNA A DNA Mapp Seq Anal. 2016 Nov;27(6):4397-4398. doi: 10.3109/19401736.2015.1089540. Epub 2015 Oct 17. Mitochondrial DNA A DNA Mapp Seq Anal. 2016. PMID: 26477699
-
Avian Genomes Revisited: Hidden Genes Uncovered and the Rates versus Traits Paradox in Birds.Mol Biol Evol. 2017 Dec 1;34(12):3123-3131. doi: 10.1093/molbev/msx236. Mol Biol Evol. 2017. PMID: 28962031
-
Reptiles and mammals have differentially retained long conserved noncoding sequences from the amniote ancestor.Genome Biol Evol. 2011;3:102-13. doi: 10.1093/gbe/evq087. Epub 2010 Dec 23. Genome Biol Evol. 2011. PMID: 21183607 Free PMC article.
-
Genome evolution in Reptilia, the sister group of mammals.Annu Rev Genomics Hum Genet. 2010;11:239-64. doi: 10.1146/annurev-genom-082509-141646. Annu Rev Genomics Hum Genet. 2010. PMID: 20590429 Review.
-
[Genomic structure and sex determination in squamate reptiles].Tsitologiia. 2013;55(4):253-8. Tsitologiia. 2013. PMID: 23875459 Review. Russian.
Cited by
-
Shark genomes provide insights into elasmobranch evolution and the origin of vertebrates.Nat Ecol Evol. 2018 Nov;2(11):1761-1771. doi: 10.1038/s41559-018-0673-5. Epub 2018 Oct 8. Nat Ecol Evol. 2018. PMID: 30297745
-
Discovery of All Three Types in Cartilaginous Fishes Enables Phylogenetic Resolution of the Origins and Evolution of Interferons.Front Immunol. 2019 Jul 12;10:1558. doi: 10.3389/fimmu.2019.01558. eCollection 2019. Front Immunol. 2019. PMID: 31354716 Free PMC article.
-
A vertebrate-wide catalogue of T1R receptors reveals diversity in taste perception.Nat Ecol Evol. 2024 Jan;8(1):111-120. doi: 10.1038/s41559-023-02258-8. Epub 2023 Dec 13. Nat Ecol Evol. 2024. PMID: 38093021 Free PMC article.
-
Chromosome-level genome assembly and annotation of the crested gecko, Correlophus ciliatus, a lizard incapable of tail regeneration.GigaByte. 2024 Nov 6;2024:gigabyte140. doi: 10.46471/gigabyte.140. eCollection 2024. GigaByte. 2024. PMID: 39539519 Free PMC article.
-
Individual and age-related variation of cellular brain composition in a squamate reptile.Biol Lett. 2020 Sep;16(9):20200280. doi: 10.1098/rsbl.2020.0280. Epub 2020 Sep 23. Biol Lett. 2020. PMID: 32961085 Free PMC article.
References
Publication types
MeSH terms
LinkOut - more resources
Full Text Sources
Other Literature Sources
Miscellaneous
