

An NMR strategy to detect conformational differences in a protein complexed with highly analogous inhibitors in solution
- PMID: 29656080
- PMCID: PMC6133750
- DOI: 10.1016/j.ymeth.2018.04.005
An NMR strategy to detect conformational differences in a protein complexed with highly analogous inhibitors in solution
Abstract
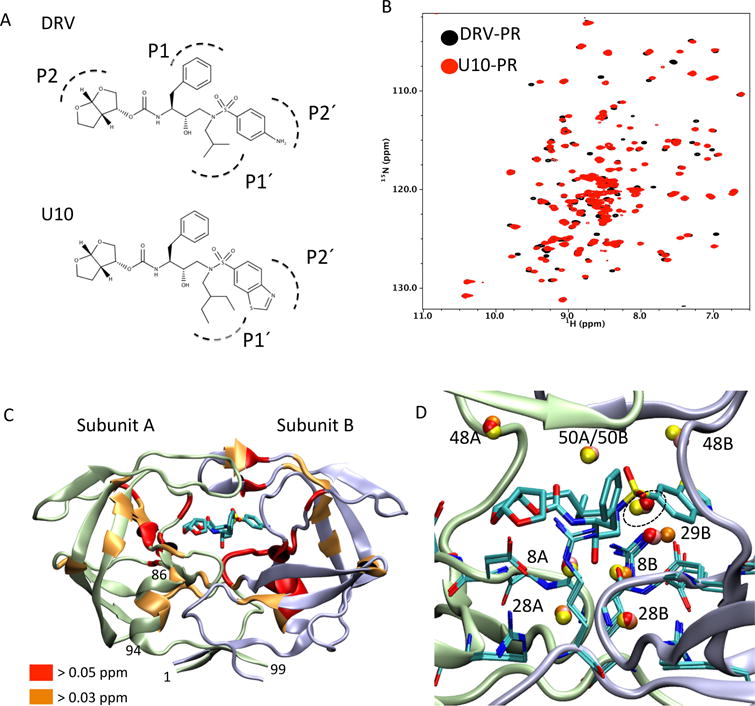
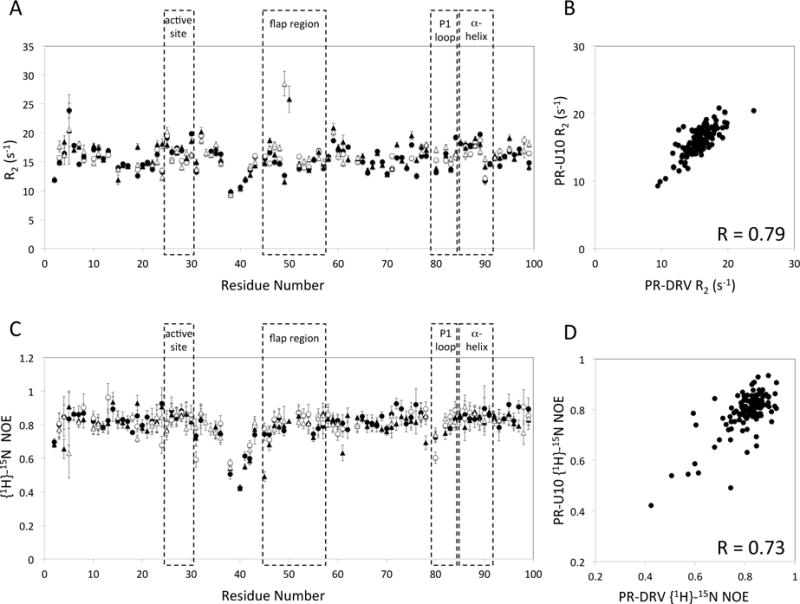
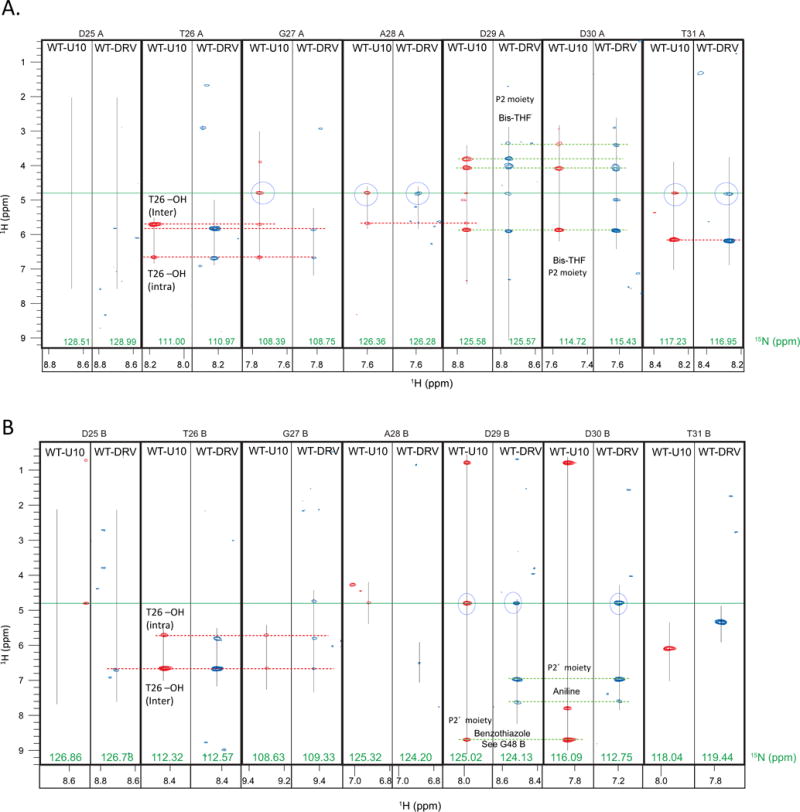
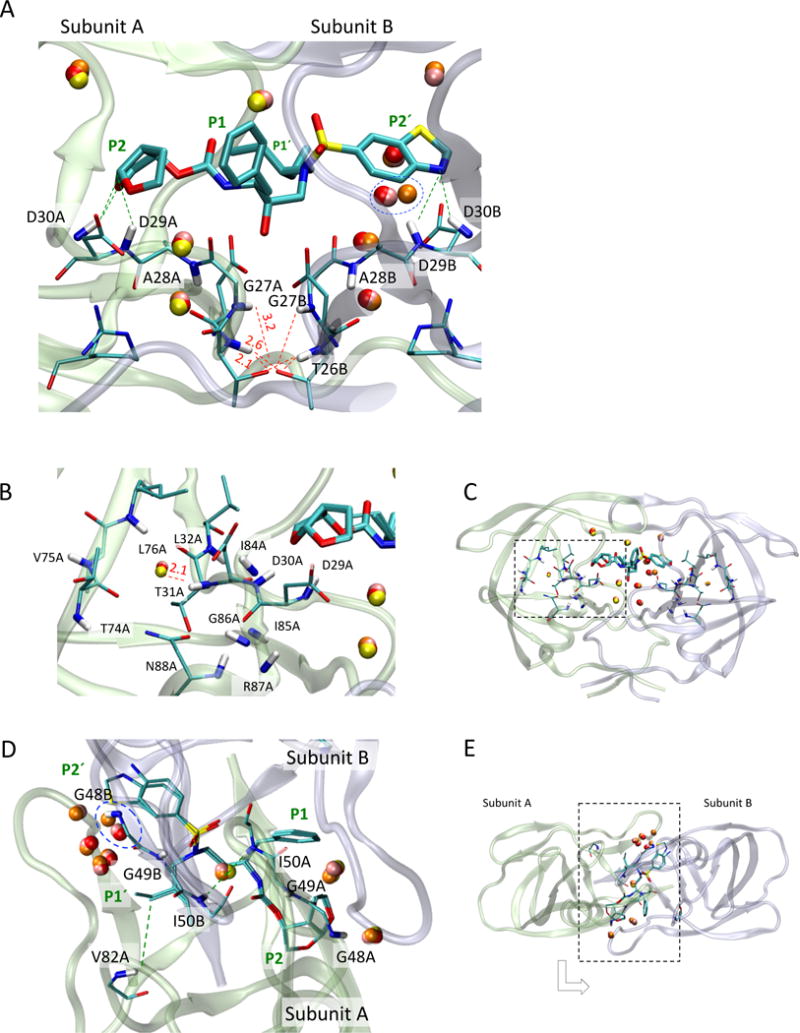
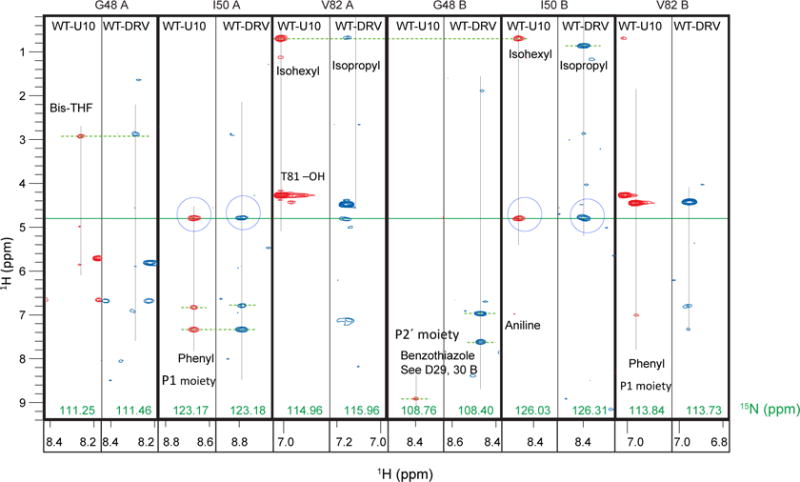
This manuscript presents an NMR strategy to investigate conformational differences in protein-inhibitor complexes, when the inhibitors tightly bind to a protein at sub-nanomolar dissociation constants and are highly analogous to each other. Using HIV-1 protease (PR), we previously evaluated amide chemical shift differences, ΔCSPs, of PR bound to darunavir (DRV) compared to PR bound to several DRV analogue inhibitors, to investigate subtle but significant long-distance conformation changes caused by the inhibitor's chemical moiety variation [Khan, S. N., Persons, J. D. Paulsen, J. L., Guerrero, M., Schiffer, C. A., Kurt-Yilmaz, N., and Ishima, R., Biochemistry, (2018), 57, 1652-1662]. However, ΔCSPs are not ideal for investigating subtle PR-inhibitor interface differences because intrinsic differences in the electron shielding of the inhibitors affect protein ΔCSPs. NMR relaxation is also not suitable as it is not sensitive enough to detect small conformational differences in rigid regions among similar PR-inhibitor complexes. Thus, to gain insight into conformational differences at the inhibitor-protein interface, we recorded 15N-half filtered NOESY spectra of PR bound to two highly analogous inhibitors and assessed NOEs between PR amide protons and inhibitor protons, between PR amide protons and hydroxyl side chains, and between PR amide protons and water protons. We also verified the PR amide-water NOEs using 2D water-NOE/ROE experiments. Differences in water-amide proton NOE peaks, possibly due to amide-protein hydrogen bonds, were observed between subunit A and subunit B, and between the DRV-bound form and an analogous inhibitor-bound form, which may contribute to remote conformational changes.
Keywords: Deuteration; HSQC; NMR; NOE; Protein; Relaxation; Water.
Copyright © 2018 Elsevier Inc. All rights reserved.
Figures
Similar articles
-
Probing Structural Changes among Analogous Inhibitor-Bound Forms of HIV-1 Protease and a Drug-Resistant Mutant in Solution by Nuclear Magnetic Resonance.Biochemistry. 2018 Mar 13;57(10):1652-1662. doi: 10.1021/acs.biochem.7b01238. Epub 2018 Feb 19. Biochemistry. 2018. PMID: 29457713 Free PMC article.
-
Detection of intermolecular NOE interactions in large protein complexes.Prog Nucl Magn Reson Spectrosc. 2016 Nov;97:40-56. doi: 10.1016/j.pnmrs.2016.08.002. Epub 2016 Aug 18. Prog Nucl Magn Reson Spectrosc. 2016. PMID: 27888839 Review.
-
Mapping hydration water molecules in the HIV-1 protease/DMP323 complex in solution by NMR spectroscopy.Biochemistry. 1996 Oct 1;35(39):12694-704. doi: 10.1021/bi9610764. Biochemistry. 1996. PMID: 8841113
-
Thermodynamic origin of cis/trans isomers of a proline-containing beta-turn model dipeptide in aqueous solution: a combined variable temperature 1H-NMR, two-dimensional 1H,1H gradient enhanced nuclear Overhauser effect spectroscopy (NOESY), one-dimensional steady-state intermolecular 13C,1H NOE, and molecular dynamics study.Biopolymers. 2000 Jan;53(1):72-83. doi: 10.1002/(SICI)1097-0282(200001)53:1<72::AID-BIP7>3.0.CO;2-5. Biopolymers. 2000. PMID: 10644952
-
Position of residues in transmembrane peptides with respect to the lipid bilayer: a combined lipid Noes and water chemical exchange approach in phospholipid bicelles.J Biomol NMR. 2002 Jan;22(1):57-64. doi: 10.1023/a:1013817818794. J Biomol NMR. 2002. PMID: 11885981
Cited by
-
Using modern approaches to sedimentation velocity to detect conformational changes in proteins.Eur Biophys J. 2020 Dec;49(8):729-743. doi: 10.1007/s00249-020-01453-w. Epub 2020 Aug 5. Eur Biophys J. 2020. PMID: 32761255 Free PMC article.
-
NMR and MD studies combined to elucidate inhibitor and water interactions of HIV-1 protease and their modulations with resistance mutations.J Biomol NMR. 2019 Jul;73(6-7):365-374. doi: 10.1007/s10858-019-00260-6. Epub 2019 Jun 26. J Biomol NMR. 2019. PMID: 31243634 Free PMC article.
References
-
- Wlodawer A, Erickson JW. Structure-based inhibitors of HIV-1 protease. Annu Rev Biochem. 1993;62:543–585. - PubMed
-
- Ghosh AK, Chapsal BD, Weber IT, Mitsuya H. Design of HIV protease inhibitors targeting protein backbone: an effective strategy for combating drug resistance. Acc Chem Res. 2008;41:78–86. - PubMed
-
- Macalino SJ, Gosu V, Hong S, Choi S. Role of computer-aided drug design in modern drug discovery. Arch Pharm Res. 2015;38:1686–1701. - PubMed
Publication types
MeSH terms
Substances
Grants and funding
LinkOut - more resources
Full Text Sources
Other Literature Sources
Research Materials
