

Therapeutic conserved elements (CE) DNA vaccine induces strong T-cell responses against highly conserved viral sequences during simian-human immunodeficiency virus infection
- PMID: 29648490
- PMCID: PMC6067903
- DOI: 10.1080/21645515.2018.1448328
Therapeutic conserved elements (CE) DNA vaccine induces strong T-cell responses against highly conserved viral sequences during simian-human immunodeficiency virus infection
Abstract
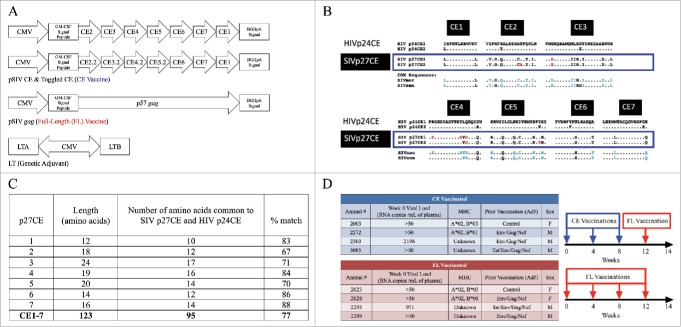
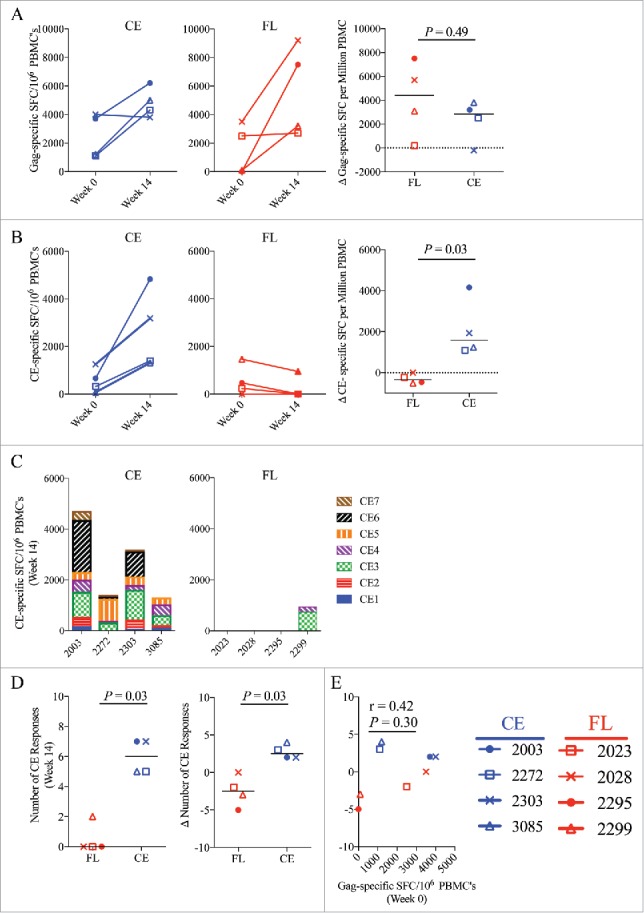
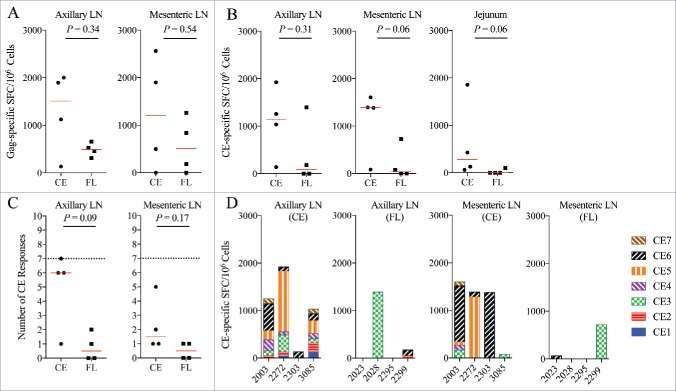
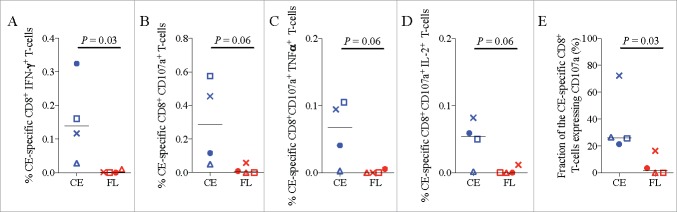
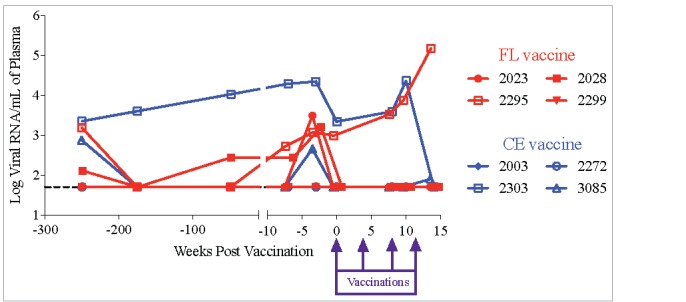
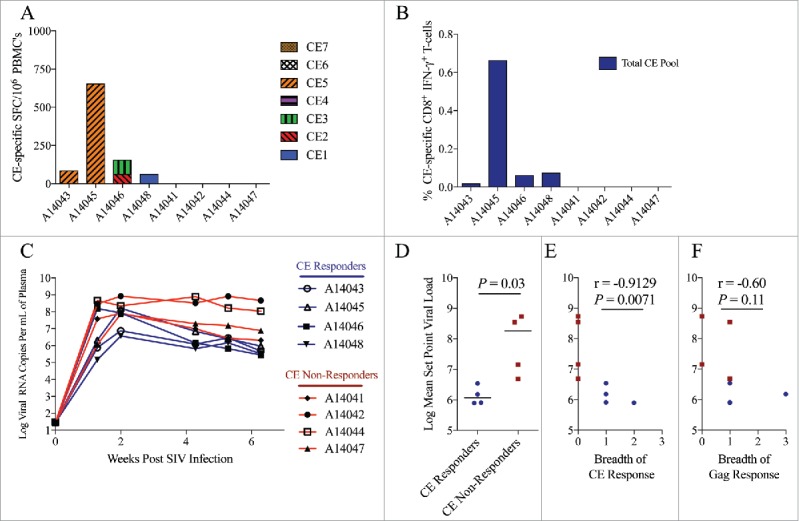
HIV-specific T-cell responses play a key role in controlling HIV infection, and therapeutic vaccines for HIV that aim to improve viral control will likely need to improve on the T-cell responses induced by infection. However, in the setting of chronic infection, an effective therapeutic vaccine must overcome the enormous viral genetic diversity and the presence of pre-existing T-cell responses that are biased toward immunodominant T-cell epitopes that can readily mutate to evade host immunity and thus potentially provide inferior protection. To address these issues, we investigated a novel, epidermally administered DNA vaccine expressing SIV capsid (p27Gag) homologues of highly conserved elements (CE) of the HIV proteome in macaques experiencing chronic but controlled SHIV infection. We assessed the ability to boost or induce de novo T-cell responses against the conserved but immunologically subdominant CE epitopes. Two groups of animals were immunized with either the CE DNA vaccine or a full-length SIV p57gag DNA vaccine. Prior to vaccination, CE responses were similar in both groups. The full-length p57gag DNA vaccine, which contains the CE, increased overall Gag-specific responses but did not increase CE responses in any animals (0/4). In contrast, the CE DNA vaccine increased CE responses in all (4/4) vaccinated macaques. In SIV infected but unvaccinated macaques, those that developed stronger CE-specific responses during acute infection exhibited lower viral loads. We conclude that CE DNA vaccination can re-direct the immunodominance hierarchy towards CE in the setting of attenuated chronic infection and that induction of these responses by therapeutic vaccination may improve immune control of HIV.
Keywords: DNA vaccines; HIV; SHIV; SIV; conserved elements vaccine; gag; therapeutic vaccination.
Figures
Similar articles
-
Gag and env conserved element CE DNA vaccines elicit broad cytotoxic T cell responses targeting subdominant epitopes of HIV and SIV Able to recognize virus-infected cells in macaques.Hum Vaccin Immunother. 2018;14(9):2163-2177. doi: 10.1080/21645515.2018.1489949. Epub 2018 Jul 12. Hum Vaccin Immunother. 2018. PMID: 29939820 Free PMC article.
-
DNA Prime-Boost Vaccine Regimen To Increase Breadth, Magnitude, and Cytotoxicity of the Cellular Immune Responses to Subdominant Gag Epitopes of Simian Immunodeficiency Virus and HIV.J Immunol. 2016 Nov 15;197(10):3999-4013. doi: 10.4049/jimmunol.1600697. Epub 2016 Oct 12. J Immunol. 2016. PMID: 27733554 Free PMC article.
-
Vaccination of Macaques with DNA Followed by Adenoviral Vectors Encoding Simian Immunodeficiency Virus (SIV) Gag Alone Delays Infection by Repeated Mucosal Challenge with SIV.J Virol. 2019 Oct 15;93(21):e00606-19. doi: 10.1128/JVI.00606-19. Print 2019 Nov 1. J Virol. 2019. PMID: 31413132 Free PMC article.
-
Current situation in the development of a preventive HIV vaccine.Enferm Infecc Microbiol Clin. 2005 Jul;23 Suppl 2:5-24. doi: 10.1016/S0213-005X(05)75156-9. Enferm Infecc Microbiol Clin. 2005. PMID: 16373000 Free PMC article. Review. English, Spanish.
-
Determining the immune mechanisms of protection from AIDS: correlates of immunity and the development of syngeneic macaques.Immunol Rev. 2001 Oct;183:94-108. doi: 10.1034/j.1600-065x.2001.1830108.x. Immunol Rev. 2001. PMID: 11782250 Review.
Cited by
-
Development and Preclinical Evaluation of an Integrase Defective Lentiviral Vector Vaccine Expressing the HIVACAT T Cell Immunogen in Mice.Mol Ther Methods Clin Dev. 2020 Feb 4;17:418-428. doi: 10.1016/j.omtm.2020.01.013. eCollection 2020 Jun 12. Mol Ther Methods Clin Dev. 2020. PMID: 32154327 Free PMC article.
-
An Alphavirus-derived replicon RNA vaccine induces SARS-CoV-2 neutralizing antibody and T cell responses in mice and nonhuman primates.Sci Transl Med. 2020 Aug 5;12(555):eabc9396. doi: 10.1126/scitranslmed.abc9396. Epub 2020 Jul 20. Sci Transl Med. 2020. PMID: 32690628 Free PMC article.
-
Efficient ex vivo expansion of conserved element vaccine-specific CD8+ T-cells from SHIV-infected, ART-suppressed nonhuman primates.Front Immunol. 2023 May 3;14:1188018. doi: 10.3389/fimmu.2023.1188018. eCollection 2023. Front Immunol. 2023. PMID: 37207227 Free PMC article.
-
A novel DNA and protein combination COVID-19 vaccine formulation provides full protection against SARS-CoV-2 in rhesus macaques.Emerg Microbes Infect. 2021 Dec;10(1):342-355. doi: 10.1080/22221751.2021.1887767. Emerg Microbes Infect. 2021. PMID: 33555988 Free PMC article.
-
Computational Design of Epitope-Enriched HIV-1 Gag Antigens with Preserved Structure and Function for Induction of Broad CD8+ T Cell Responses.Sci Rep. 2018 Jul 26;8(1):11264. doi: 10.1038/s41598-018-29435-1. Sci Rep. 2018. PMID: 30050069 Free PMC article.
References
-
- Gupta RK, Jordan MR, Sultan BJ, Hill A, Davis DH, Gregson J, Sawyer AW, Hamers RL, Ndembi N, Pillay D, et al Global trends in antiretroviral resistance in treatment-naive individuals with HIV after rollout of antiretroviral treatment in resource-limited settings: a global collaborative study and meta-regression analysis. The Lancet. 2012;380:1250-8. doi:10.1016/S0140-6736(12)61038-1. - DOI - PMC - PubMed
-
- Butler KM, Gavin P, Coughlan S, Rochford A, Donagh SM, Cunningham O, Poulsom H, Watters S, Klein N. Rapid Viral Rebound after 4 Years of Suppressive Therapy in a Seronegative HIV-1 Infected Infant Treated from Birth. Pediatr Infect Dis J. 2014; PMID:25144802. - PubMed
Publication types
MeSH terms
Substances
Grants and funding
LinkOut - more resources
Full Text Sources
Other Literature Sources
Medical