. 2018 Apr 11:7:e32963.
doi: 10.7554/eLife.32963.

Two distinct DNA sequences recognized by transcription factors represent enthalpy and entropy optima

Affiliations

Two distinct DNA sequences recognized by transcription factors represent enthalpy and entropy optima

Ekaterina Morgunova et al. Elife. .

Abstract

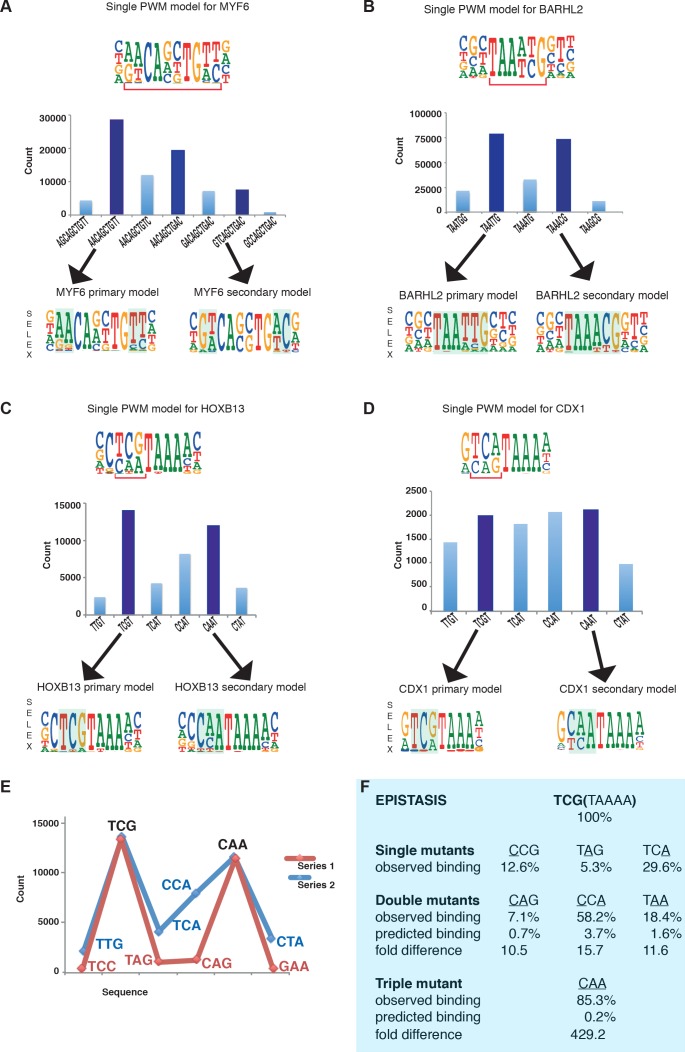
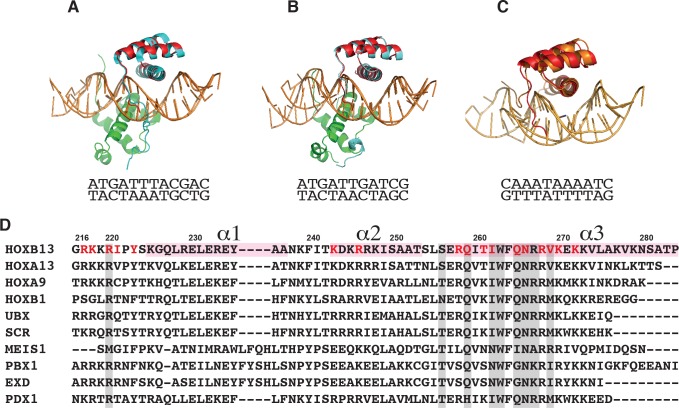
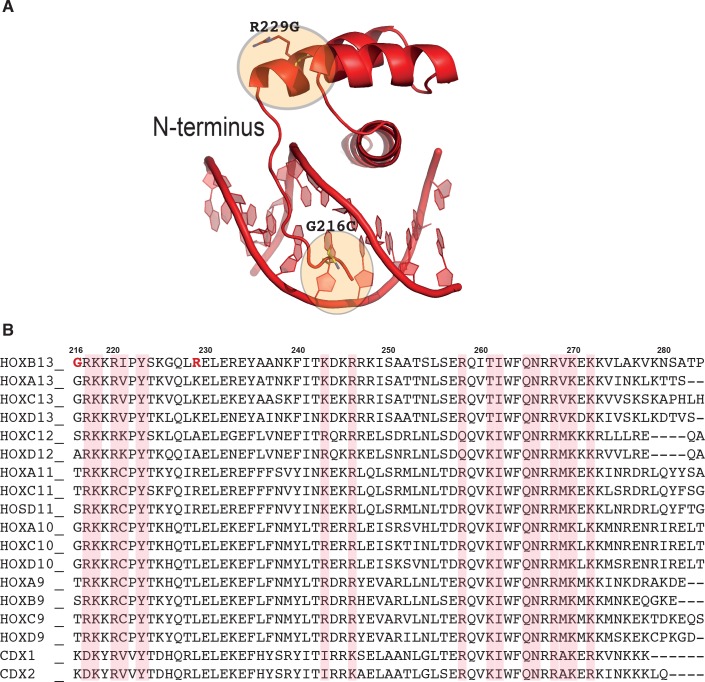
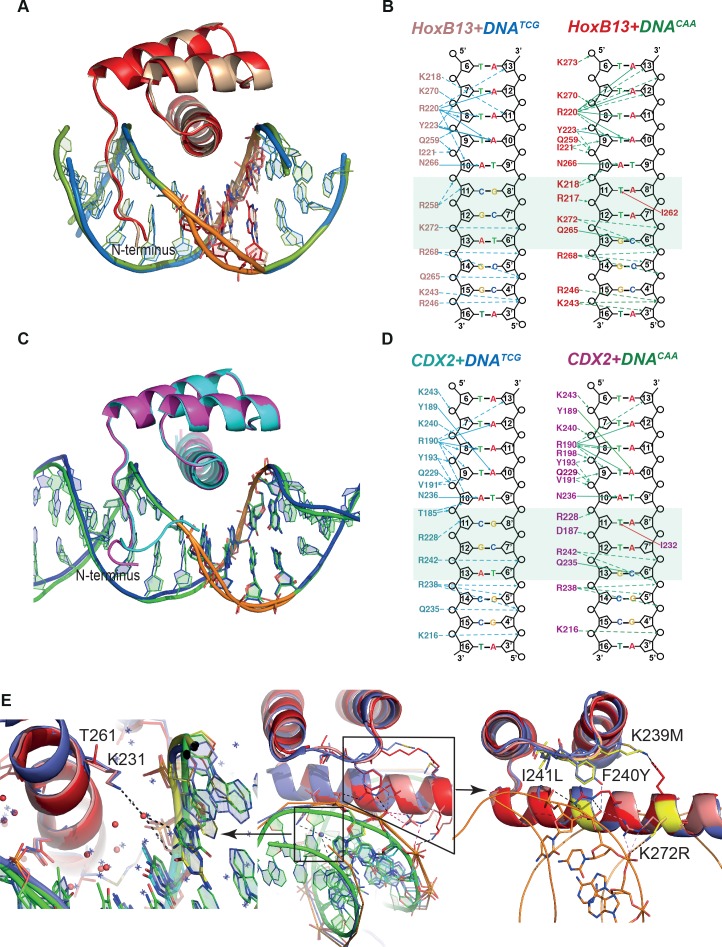
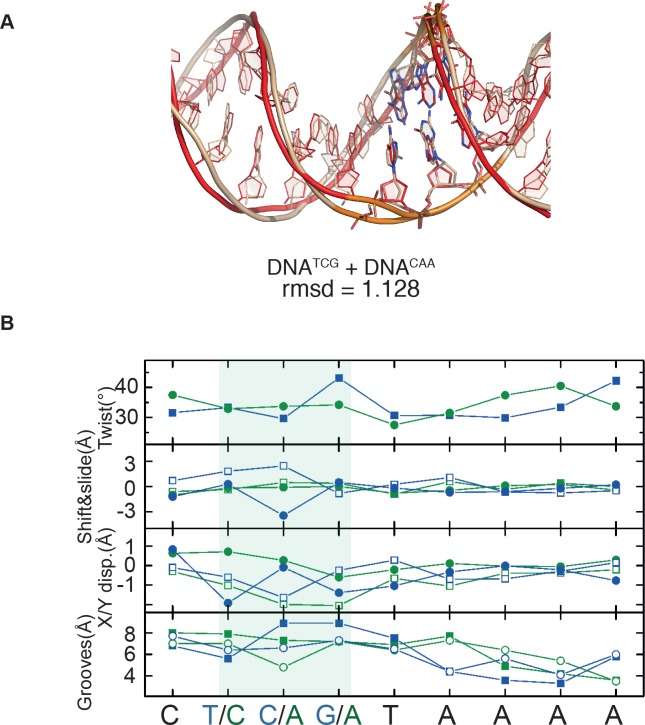
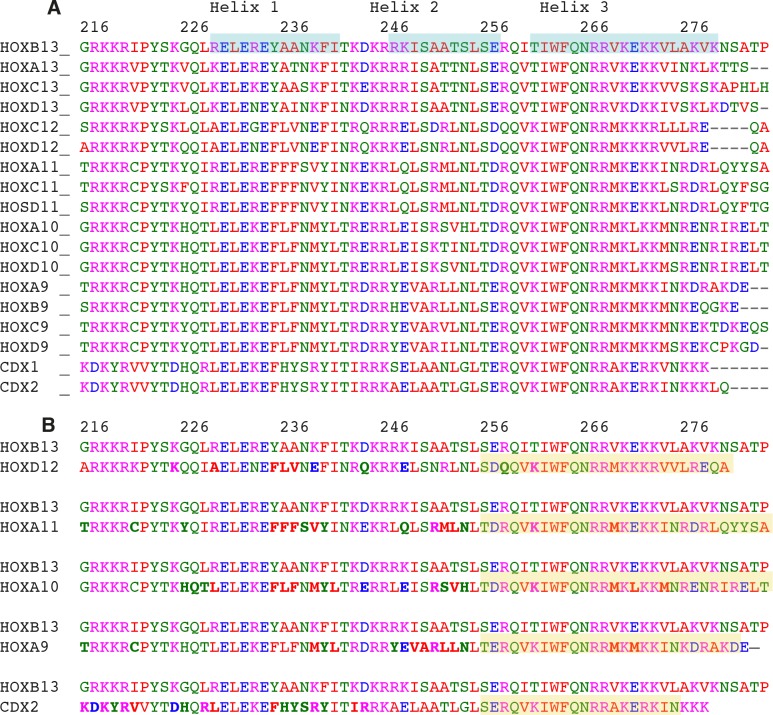
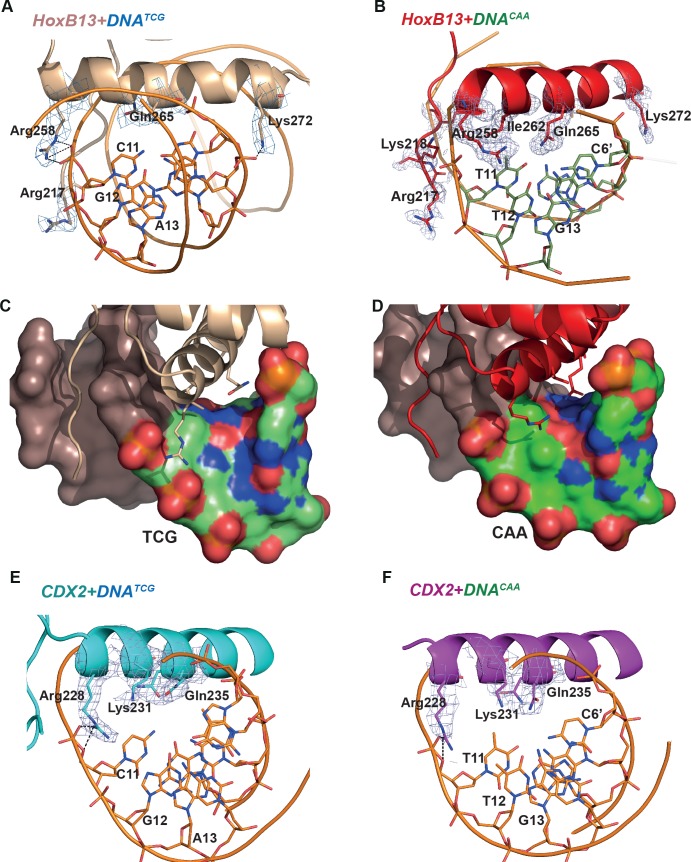
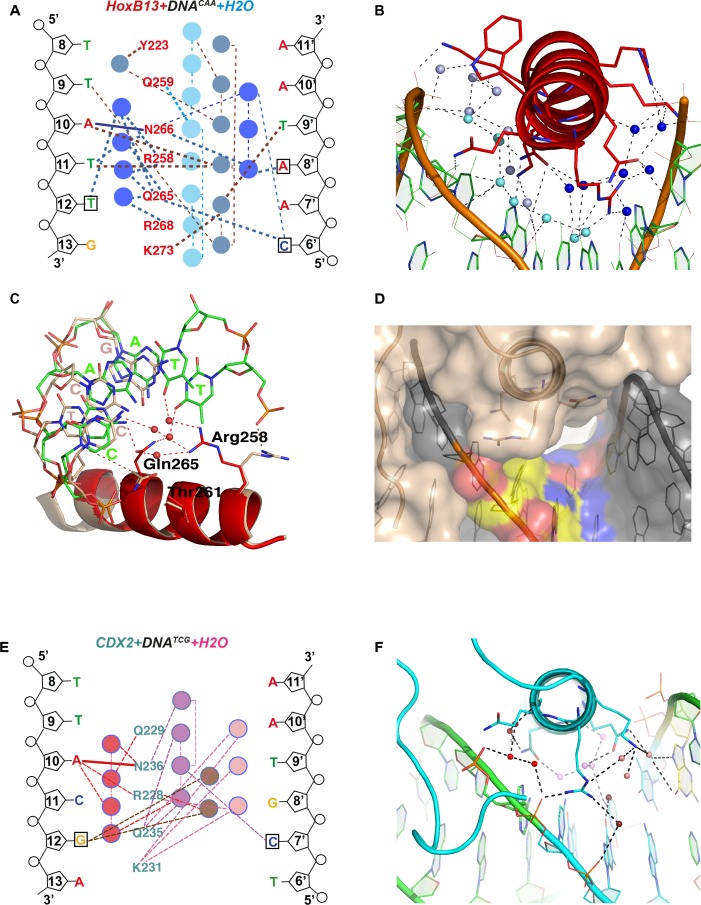
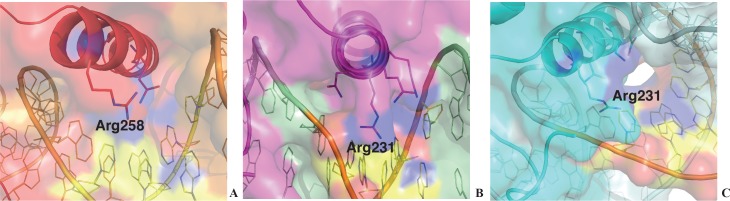
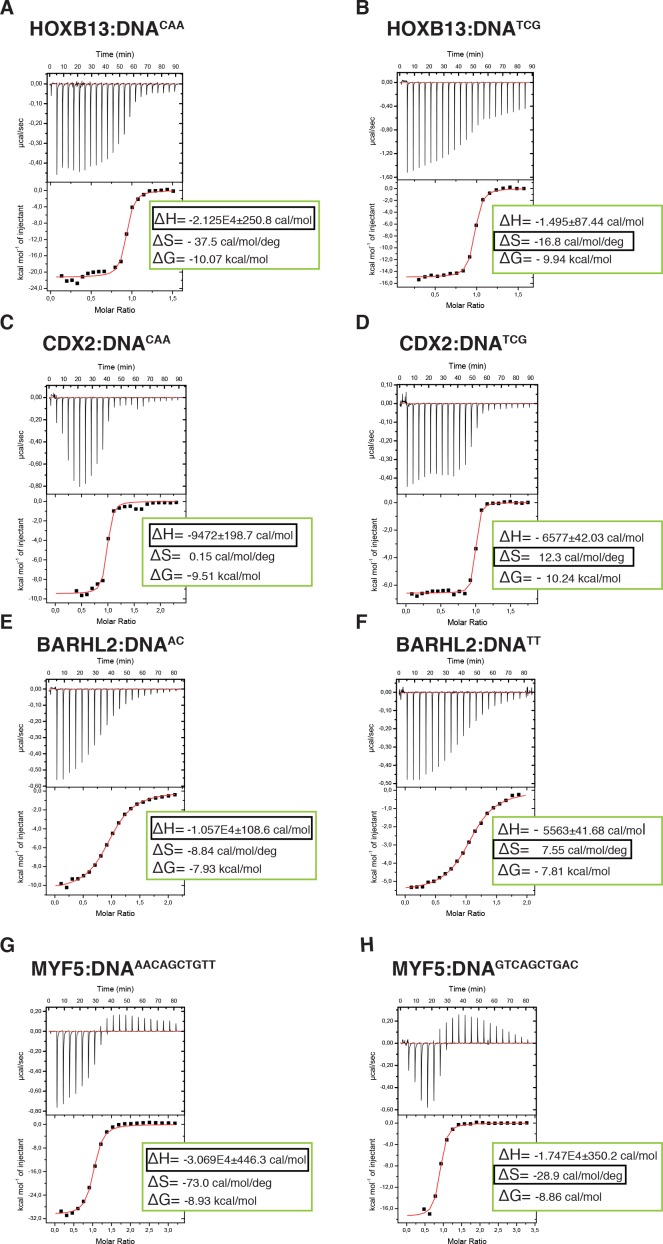
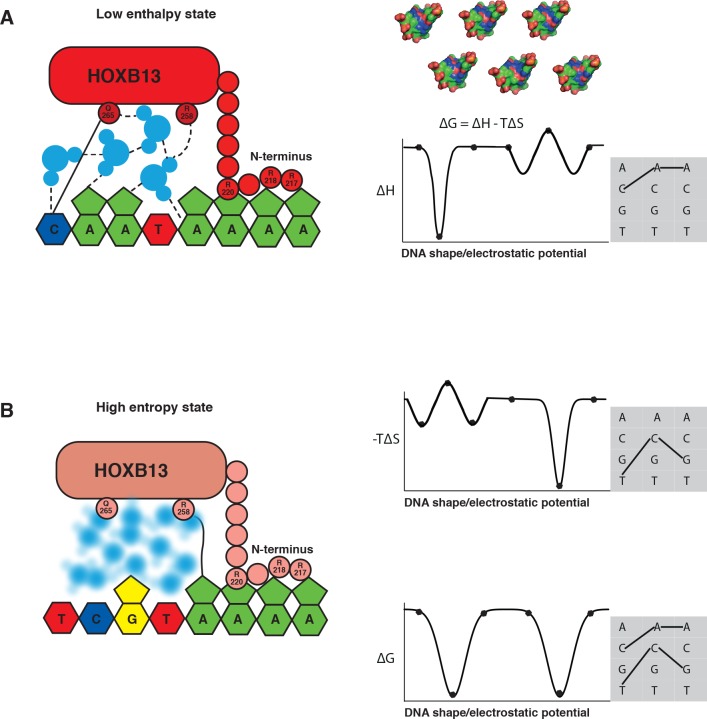
Most transcription factors (TFs) can bind to a population of sequences closely related to a single optimal site. However, some TFs can bind to two distinct sequences that represent two local optima in the Gibbs free energy of binding (ΔG). To determine the molecular mechanism behind this effect, we solved the structures of human HOXB13 and CDX2 bound to their two optimal DNA sequences, CAATAAA and TCGTAAA. Thermodynamic analyses by isothermal titration calorimetry revealed that both sites were bound with similar ΔG. However, the interaction with the CAA sequence was driven by change in enthalpy (ΔH), whereas the TCG site was bound with similar affinity due to smaller loss of entropy (ΔS). This thermodynamic mechanism that leads to at least two local optima likely affects many macromolecular interactions, as ΔG depends on two partially independent variables ΔH and ΔS according to the central equation of thermodynamics, ΔG = ΔH - TΔS.

Keywords: DNA recognition; biochemistry; chemical biology; enthalpy; entropy; epistasis; human; molecular biophysics; structural biology; thermodynamics; transcription factors.


Conflict of interest statement

EM, YY, PD, AJ, FZ, AP, YX, LN, JT No competing interests declared

Figures

Figure 1.
Figure 1.. Multiple TFs prefer to bind to two optimal sequences.
(A) MYF6 (this study); (B) BARHL2 (this study); (C) HOXB13 (Yin et al., 2017); (D) CDX1 (Yin et al., 2017). Note that single PWM models (top) fail to describe sequence specificity towards different sequences shown in the bar graphs (middle). For example, a single PWM model for HOXB13 (panel C, top) predicts near-equal affinities towards sequences TCG and TCA at the position of the bracket, and lower affinity towards CAA. Analysis of the counts of the subsequences (middle), instead, reveals that the TCA sequence is bound more weakly than the two most preferred sequences TCG and CAA. Counts for local maxima (dark blue) and related sequences that differ from the maxima by one or more base substitutions are also shown (light blue). The bars between the maxima represent sequences that can be obtained from both maximal sequences and have the highest count between the maxima. Bottom of each figure: Two distinct models that can represent the binding specificity of the TFs, the divergent bases are indicated by shading. For clarity, the PWM for the MYF6 optima that contains both AA and AC dinucleotide flanks (middle dark blue bar in A) is not shown. (E) Sequences representing the highest (blue line) and lowest (red line) affinity sequences between the two optimal HOXB13 sequences. y-axis: counts for 8-mer sequences containing the indicated trinucleotide followed by TAAA. (F) Epistasis in HOXB13-DNA binding. The effect of individual mutations (single mutants) to the optimal sequence TCGTAAAA (top) are relatively severe, with binding decreasing by more than 70% in all cases (observed binding). However, combinations of the mutations (double mutants) do not decrease HOXB13 binding in a multiplicative manner (compare predicted and observed binding). A multiplicative model predicts that combining all three substitutions would abolish binding, but instead the CAA site is bound more strongly than any other mutant (triple mutant).
Figure 1—figure supplement 1.
Figure 1—figure supplement 1.. The comparison of HOXB13 structure with HOXB1 and HOXA9.
The superposition of HOXB13-DNACAA complex (red) with: (A) HOXA9:PBX1-DNA complex (HOXA9 is in cyan, PBX1 is green, PDB entry 1PUF); (B) with HOXB1:PBX1-DNA complex (HOXB1 is in cyan, PBX1 is in green, PDB entry 1B72); (C) with HOXA13-DNA complex (HOXA13 is in orange, PDB entry 2LD5). The corresponding DNA sequences are presented under pictures. (D) The sequence alignment of Hox proteins with known structures. The numbering corresponds to HOXB13. Three helices are labeled on the top and highlighted with light pink. The residues involved in interactions are highlighted in grey. The residues involved in interaction in HOXB13 are colored red.
Figure 1—figure supplement 2.
Figure 1—figure supplement 2.. HOXB13 prostate cancer mutation.
(A) Structural representation of two of three residues found mutated in single prostate cancer families, Gly-216-Cys and Arg-229-Gly. The mutated residues are presented in ball-and-stick style and highlighted with orange rings. Note that the first mutation Gly-216-Cys belonging to the N-termini of HOXB13 DBD can affect the interactions forming by protein in narrow minor groove. The other mutation Arg-229-Gly is located at the beginning of helix one and because glycine residue is known as ‘helix-breaker’ the mutation can affect the interaction between N-termini with DNA as well as the interaction between two helixes. (B) Sequence alignment of posterior members of HOX family. The cancer mutations found in HOXB13 are colored red. Light red columns highlight the residues involved in interactions with DNA. The numbering corresponds to HOXB13.
Figure 2.
Figure 2.. Comparison of Protein-DNA complexes.
(A) The view of superposition of HOXB13 (wheat) bound to DNATCG and HOXB13 (red) bound to DNACAA (rmsd = 0.813 Å on 57 residues). The respective DNAs are in blue and green. The dissimilar base pairs are presented as ball-and-stick models and colored as the proteins, DNATCG is wheat and DNACAA is red. Note the different bending of the DNA backbone at these positions (orange). (B) Schematic representation of interactions formed between HOXB13 DBD and the two different DNAs: left panel shows the interactions between HOXB13 and the primary binding site (DNATCG) and right panel represents the interactions of HOXB13 with the secondary site (DNACAA), respectively. Dashed lines represent interaction with backbone phosphates and deoxyribose and solid lines interactions with the bases. The protein residues belonging to the HOXB13-DNATCG and HOXB13-DNACAA structures are colored wheat and red, respectively. The divergent parts of the DNA sequences are highlighted by a light green box. Note that the TCG site lacks direct contacts to the DNA bases, whereas the CAA site is recognized by direct contacts by Gln-265 and Ile-262. Most other contacts are similar in both structures. The four As of the TAAAA sequence are recognized by the N-terminal amino-acids interacting with the DNA backbone via the minor groove, whereas the T is recognized by a bidentate interaction formed between its complementary adenine A10 and the side chain of asparagine Asn-266. Two hydrogen bonds are formed between nitrogen atoms N6 and N7 from adenine base and oxygen and nitrogen atoms of the Asn-266 side chain. This adenine-specific asparagine is totally conserved in the HOX family. (C) Superposition of CDX2 (cyan) bound to DNATCG and CDX2 (magenta) bound to DNACAA (rmsd = 0.270 Å on 64 residues). The respective DNAs are in blue and green. The dissimilar base pairs are presented as ball-and-stick models and colored as the proteins, DNATCG is green and DNACAA is blue. Note the different bending of the DNA backbone at these positions (orange). (D) Schematic representation of interactions formed between CDX2 DBD and the two different DNAs. (E) Structural interpretation of mutations that change the specificity of HOXB13: the mutations changing Ccaa/Ctcg to Gcaa/Gtcg are shown in a small box and, as a close view, on the left panel, and mutations, which switch the preferences of HOXB13 from CTCG to CCAA, are shown in big box and, as a close view, on the right panel. The mutations are presented in structural alignment of HOXB13 (red), HOXA9 (blue, PDB entry 1PUF) and CDX2 (pink) bound to DNA. Note the unique mutation of Lys (small box), which is conserved in all known HOXes, to Thr in HOXB13 allows HOXB13 to accept any base pair in the position before TCG/CAA. The left panel is representing the close view to the interactions formed by Lys in HOXA9 and CDX2. Long aliphatic chain of Lys increases the hydrophobicity of this part of protein-DNA interface, pushing out the water molecules. Dashed line indicates water-mediated interaction between the ε-Amino group of Lys and the N7 and O6 of the guanine base at the Gtcg sequence. The right panel is representing the close view of triple mutation in the loop connecting helix 1 and helix 2: Lys-239/Met, Phe-240/Tyr and Ile-241/Leu; and single mutation of Lys-272/Arg. Those mutations are expected to change the hydrogen bond network between the protein and DNA and lead to a preference towards the more rigid, more B-shaped DNACAA.
Figure 2—figure supplement 1.
Figure 2—figure supplement 1.. Paiwise comparison of two DNA molecules.
(A) Pairwise comparisons of DNATCG (wheat) and DNACAA (red); (B) Helicoidal parameters for HOXB13-DNATCG (blue) and HOXB13-DNACAA (green). Top: Helical twist; Middle top: shift (squares) and slide (circles); Middle bottom: X- (squares) and Y-displacements (circles); Bottom: Minor groove width (squares) and major groove depth (circles). The most pronounced differences are found for the TCGT and CAAT positions.
Figure 2—figure supplement 2.
Figure 2—figure supplement 2.. HOXB13 - HOXes/CDX mutations.
(A) Sequence alignment of HOXB13 with other HOXes. Secondary structure (alpha-helixes) of HOXB13 is highlighed in cyan. (B) The pairwise alignment; note that in addition to single mutations there are combined mutations and replacement of Helix 3 (DNA-binding helix) to corresponding helix of other HOXes (highlighted in yellow). The numbering on the top of the sequences is HOXB13 numbering.
Figure 3.
Figure 3.. Close view of the protein-DNA interactions.
(A) HOXB13-DNATCG and (B) HOXB13-DNACAA complexes. The 2mFo-Fc maps contoured with 1.5σ are shown around the key residues. The residues and base pairs involved in protein to DNA contacts are also labeled. (C, D) Surface representation of the major groove in HOXB13-DNATCG and HOXB13-DNACAA complexes, respectively. The divergent bases are colored to indicate electrostatic charges of the atoms: neutral carbon atoms are green, oxygen atoms (negative) are red and nitrogen atoms (positive) are blue. Note the larger solvent-accessible space between amino-acids and bases in the TCG structure (C) and the difference in distribution of the positively and negatively charged spots on the surface that can contribute to differences in distribution of water molecules on the surface. (E) CDX2-DNATCG and (F) CDX2-DNACAA complexes. The 2mFo-Fc maps contoured with 1.5σ are shown around the key residues. The residues and base pairs involved in protein to DNA contacts are also labeled.
Figure 4.
Figure 4.. Close view of the role of water molecules in HOXB13-DNA interaction.
(A) Schematic representation of water-mediated interactions between amino-acids (red typeface) of HOXB13 and DNA bases in the HOXB13-DNACAA structure. Different water chains are indicated with different shades of blue. Thick dashed lines represent interactions formed between water molecules and bases or amino acids; thin dashed lines represent contacts formed between water molecules, and solid blue line indicates the direct interaction between A10 and Asn-266. Note that all of the base positions in the CAA sequence (boxes) are recognized via direct or water-mediated hydrogen bonds. (B) Structural representation of the network of interactions schematically presented in (A). Note the three water chains colored by slightly varied blue color. The amino acids and bases involved in interactions are presented as stick models. (C) Close view to the different conformations of amino-acids observed in HOXB13-DNATCG and HOXB13-DNACAA structures. Note that the conformations of the key amino-acids Gln-265 and Arg-258 that interact with the water network in HOXB13-DNACAA (amino-acids in red, DNA carbons in green) are not suitable for interacting with the network in HOXB13-DNATCG (amino-acids and DNA carbons in wheat). (D) Surface representation of protein-DNA interface of HOXB13-DNATCG complex. Relatively large channel between the protein and DNA that goes through the protein-DNA interface (white) lend support to the presence of mobile water molecules in this region. TCG-bases are colored by atoms: carbon atoms are yellow; oxygen atoms are red and nitrogen atoms are blue. (E) Schematic representation of water-mediated interactions between amino-acids (cyan typeface) of CDX2 and DNA bases in the CDX2-DNATCG structure. Different water chains are indicated with different shades of red. Thick dashed lines represent interactions formed between water molecules and bases or amino acids; thin dashed lines represent contacts formed between water molecules, and solid red line indicates the direct interaction between A10 and Asn-236. Note that only the position of the GC pair is recognized (boxes) via water-mediated hydrogen bonds. (F) Structural representation of the network of interactions schematically presented in (E). Note the three water chains colored by varied red-pink color. The amino acids and bases involved in interactions are presented as stick models.
Figure 4—figure supplement 1.
Figure 4—figure supplement 1.. Surface representation of protein-DNA interface of HOXB13:DNACAA complex (A); CDX2:DNACAA (B) and CDX2:DNATCG (C).
The large channel between the protein and DNA presented in HOXB13:DNATCG complex (Figure 4D) is not presented in HOXB13:DNACAA (A) and CDX2:DNACAA (B), although it is very well visible on one side in the structure of CDX2:DNATCG (C) supporting the idea of the presence of mobile water molecules in this region. The color code is corresponding to the color code kept through the main figures of the paper: HOXB13:DNACAA is red, CDX2:DNACAA is magenta and CDX2:DNATCG is cyan. The TCG/CAA bases are colored by atoms: carbon atoms are yellow; nitrogen atoms are blue and oxygen atoms are red.
Figure 5.
Figure 5.. Calorimetric titration data reveals that two optimal DNA sequences recognized by HOXB13 (A, B), CDX2 (C, D), BARHL2 (E, F) and MYF5 (G, H) represent enthalpy and entropy optima.
The optimal sequences with higher enthalpic contribution to binding are presented on the left side (A, C, E, G) and the reactions with higher entropic contribution are presented on the right side (B, D, F, H). Note that for each protein both DNAs are bound with similar ΔG. The top panels of the ITC figures represent raw data; the bottom panels show the integrated heat of the binding reaction. The red line represents the best fit to the data, according to the model that assumes a single set of identical sites. The determined changes of enthalpy and calculated losses of entropy are shown on the bottom panel. The changes of Gibbs free energy, ∆G=∆H-T∆S, are also calculated and presented on the bottom panel of each isotherm.
Figure 5—figure supplement 1.
Figure 5—figure supplement 1.. Distribution of water-bridge lifetimes in HOXB13:DNA complexes.
Histogram showing the distribution of lifetimes of water bridges between the protein and the DNA for the HOXB13-DNATCG and HOXB13-DNACAA systems. The histogram is constructed by calculating the duration of each water bridge with 50 ps resolution from the molecular dynamics simulations; a water bridge is considered to exist when a water molecule is simultaneously hydrogen-bonded to one of the protein residues 255–272 and one of the DNA base pairs 5'-T(6)TTTACGAG(14)−3'.
Figure 6.
Figure 6.. The two optimal sites bound by HOXB13 represent enthalpy and entropy-driven optima.
(A–B) Schematic cartoon illustrations of the binding mechanism driven by the low enthalpy (A) and by high entropy (B) are presented in the left panels. The DNA bases are presented as pyrimidine and purine rings, protein is represented as ellipsoid, N-terminus is shown bound to the minor groove created by A-stretch, and water molecules are shown schematically and colored blue. The dashed lines represent hydrogen bonds observed in the low enthalpy state; the solid line represents direct interactions between amino acids and bases. The blurred water molecules indicate the high entropy state. Hydrogen bonds that are common to both complexes are omitted for clarity. Graphs on the right show schematic illustration of the variance of enthalpy (ΔH, top), entropy (-TΔS, middle) and Gibbs free energy (ΔG) (bottom) as a function of an idealized one-dimensional continuous variable representing the high-dimensional variables of shape, electrostatic charge and vibration of DNA that vary as a function of the DNA sequence. As DNA is composed of only four bases, only discrete positions along this axis are possible (indicated by dots). Example models of shape and charge distribution of different DNA sequences (from Figure 1C) are shown as surface representation above the scheme. The surfaces are colored according to the charge distribution: positively charged atoms are in blue, negatively charged are in red and neutral atoms are in green. Note that enthalpy and entropy are partially negatively correlated, leading to binding promiscuity (wider optima in ΔG compared to ΔH and ΔS). The remaining uncorrelated component leads to the presence of two optima for ΔG (bottom). Shaded boxes on the right show simplified dinucleotide binding models that illustrate how this leads to two distinct locally optimal sequences. Note that the values are for illustration purposes only and the ‘bumps’ illustrate local entropy-enthalpy compensation that broadens the peaks of ΔG.

Similar articles

Cited by

References

    1. Adams PD, Afonine PV, Bunkóczi G, Chen VB, Davis IW, Echols N, Headd JJ, Hung LW, Kapral GJ, Grosse-Kunstleve RW, McCoy AJ, Moriarty NW, Oeffner R, Read RJ, Richardson DC, Richardson JS, Terwilliger TC, Zwart PH. PHENIX: a comprehensive Python-based system for macromolecular structure solution. Acta Crystallographica Section D Biological Crystallography. 2010;66:213–221. doi: 10.1107/S0907444909052925. - DOI - PMC - PubMed
    1. Afonine PV, Grosse-Kunstleve RW, Echols N, Headd JJ, Moriarty NW, Mustyakimov M, Terwilliger TC, Urzhumtsev A, Zwart PH, Adams PD. Towards automated crystallographic structure refinement with phenix.refine. Acta Crystallographica Section D Biological Crystallography. 2012;68:352–367. doi: 10.1107/S0907444912001308. - DOI - PMC - PubMed
    1. Aggarwal AK, Rodgers DW, Drottar M, Ptashne M, Harrison SC. Recognition of a DNA operator by the repressor of phage 434: a view at high resolution. Science. 1988;242:899–907. doi: 10.1126/science.3187531. - DOI - PubMed
    1. Anderson DW, McKeown AN, Thornton JW. Intermolecular epistasis shaped the function and evolution of an ancient transcription factor and its DNA binding sites. eLife. 2015;4:e07864. doi: 10.7554/eLife.07864. - DOI - PMC - PubMed
    1. Anderson JE, Ptashne M, Harrison SC. Structure of the repressor-operator complex of bacteriophage 434. Nature. 1987;326:846–852. doi: 10.1038/326846a0. - DOI - PubMed

Publication types

Grants and funding

The funders had no role in study design, data collection and interpretation, or the decision to submit the work for publication.