Stoichiometry and compositional plasticity of the yeast nuclear pore complex revealed by quantitative fluorescence microscopy
- PMID: 29632211
- PMCID: PMC5924907
- DOI: 10.1073/pnas.1719398115
Stoichiometry and compositional plasticity of the yeast nuclear pore complex revealed by quantitative fluorescence microscopy
Abstract
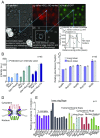
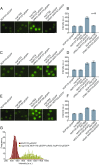
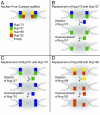
The nuclear pore complex (NPC) is an eightfold symmetrical channel providing selective transport of biomolecules across the nuclear envelope. Each NPC consists of ∼30 different nuclear pore proteins (Nups) all present in multiple copies per NPC. Significant progress has recently been made in the characterization of the vertebrate NPC structure. However, because of the estimated size differences between the vertebrate and yeast NPC, it has been unclear whether the NPC architecture is conserved between species. Here, we have developed a quantitative image analysis pipeline, termed nuclear rim intensity measurement (NuRIM), to precisely determine copy numbers for almost all Nups within native NPCs of budding yeast cells. Our analysis demonstrates that the majority of yeast Nups are present at most in 16 copies per NPC. This reveals a dramatic difference to the stoichiometry determined for the human NPC, suggesting that despite a high degree of individual Nup conservation, the yeast and human NPC architecture is significantly different. Furthermore, using NuRIM, we examined the effects of mutations on NPC stoichiometry. We demonstrate for two paralog pairs of key scaffold Nups, Nup170/Nup157 and Nup192/Nup188, that their altered expression leads to significant changes in the NPC stoichiometry inducing either voids in the NPC structure or substitution of one paralog by the other. Thus, our results not only provide accurate stoichiometry information for the intact yeast NPC but also reveal an intriguing compositional plasticity of the NPC architecture, which may explain how differences in NPC composition could arise in the course of evolution.
Keywords: NPC composition; nuclear pore complex; nucleoporins; quantitative fluorescence microscopy; stoichiometry.
Conflict of interest statement
The authors declare no conflict of interest.
Figures


Comment in
-
Yeast and Human Nuclear Pore Complexes: Not So Similar After All.Trends Cell Biol. 2018 Aug;28(8):589-591. doi: 10.1016/j.tcb.2018.06.004. Epub 2018 Jun 22. Trends Cell Biol. 2018. PMID: 29941187
Similar articles
-
Mapping the native organization of the yeast nuclear pore complex using nuclear radial intensity measurements.Proc Natl Acad Sci U S A. 2019 Jul 16;116(29):14606-14613. doi: 10.1073/pnas.1903764116. Epub 2019 Jul 1. Proc Natl Acad Sci U S A. 2019. PMID: 31262825 Free PMC article.
-
Natively Unfolded FG Repeats Stabilize the Structure of the Nuclear Pore Complex.Cell. 2017 Nov 2;171(4):904-917.e19. doi: 10.1016/j.cell.2017.09.033. Epub 2017 Oct 12. Cell. 2017. PMID: 29033133 Free PMC article.
-
Architecture of the linker-scaffold in the nuclear pore.Science. 2022 Jun 10;376(6598):eabm9798. doi: 10.1126/science.abm9798. Epub 2022 Jun 10. Science. 2022. PMID: 35679425 Free PMC article.
-
[Nuclear pores: from yeast to higher eukaryotes].J Soc Biol. 2002;196(4):349-54. J Soc Biol. 2002. PMID: 12645306 Review. French.
-
Membrane-coating lattice scaffolds in the nuclear pore and vesicle coats: commonalities, differences, challenges.Nucleus. 2010 Jul-Aug;1(4):314-8. doi: 10.4161/nucl.1.4.11798. Epub 2010 Mar 12. Nucleus. 2010. PMID: 21327078 Free PMC article. Review.
Cited by
-
Nuclear pore complexes concentrate on Actin/LINC/Lamin nuclear lines in response to mechanical stress in a SUN1 dependent manner.Heliyon. 2022 Dec 7;8(12):e12147. doi: 10.1016/j.heliyon.2022.e12147. eCollection 2022 Dec. Heliyon. 2022. PMID: 36619427 Free PMC article.
-
Imaging within single NPCs reveals NXF1's role in mRNA export on the cytoplasmic side of the pore.J Cell Biol. 2019 Sep 2;218(9):2962-2981. doi: 10.1083/jcb.201901127. Epub 2019 Aug 2. J Cell Biol. 2019. PMID: 31375530 Free PMC article.
-
Nuclear pore complexes mediate subtelomeric gene silencing by regulating PCNA levels on chromatin.J Cell Biol. 2023 Sep 4;222(9):e202207060. doi: 10.1083/jcb.202207060. Epub 2023 Jun 26. J Cell Biol. 2023. PMID: 37358474 Free PMC article.
-
Nuclear pore and nucleocytoplasmic transport impairment in oxidative stress-induced neurodegeneration: relevance to molecular mechanisms in Pathogenesis of Parkinson's and other related neurodegenerative diseases.Mol Neurodegener. 2024 Nov 23;19(1):87. doi: 10.1186/s13024-024-00774-0. Mol Neurodegener. 2024. PMID: 39578912 Free PMC article. Review.
-
Assembly principle of a membrane-anchored nuclear pore basket scaffold.Sci Adv. 2022 Feb 11;8(6):eabl6863. doi: 10.1126/sciadv.abl6863. Epub 2022 Feb 11. Sci Adv. 2022. PMID: 35148185 Free PMC article.
References
-
- Watson ML. Pores in the mammalian nuclear membrane. Biochim Biophys Acta. 1954;15:475–479. - PubMed
Publication types
MeSH terms
Substances
LinkOut - more resources
Full Text Sources
Other Literature Sources
Molecular Biology Databases

