. 2018 Apr 17;48(4):812-830.e14.
doi: 10.1016/j.immuni.2018.03.023. Epub 2018 Apr 5.

The Immune Landscape of Cancer

Collaborators, Affiliations

The Immune Landscape of Cancer

Vésteinn Thorsson et al. Immunity. .

Erratum in

  • The Immune Landscape of Cancer.
    Thorsson V, Gibbs DL, Brown SD, Wolf D, Bortone DS, Ou Yang TH, Porta-Pardo E, Gao GF, Plaisier CL, Eddy JA, Ziv E, Culhane AC, Paull EO, Sivakumar IKA, Gentles AJ, Malhotra R, Farshidfar F, Colaprico A, Parker JS, Mose LE, Vo NS, Liu J, Liu Y, Rader J, Dhankani V, Reynolds SM, Bowlby R, Califano A, Cherniack AD, Anastassiou D, Bedognetti D, Mokrab Y, Newman AM, Rao A, Chen K, Krasnitz A, Hu H, Malta TM, Noushmehr H, Pedamallu CS, Bullman S, Ojesina AI, Lamb A, Zhou W, Shen H, Choueiri TK, Weinstein JN, Guinney J, Saltz J, Holt RA, Rabkin CS; Cancer Genome Atlas Research Network; Lazar AJ, Serody JS, Demicco EG, Disis ML, Vincent BG, Shmulevich I. Thorsson V, et al. Immunity. 2019 Aug 20;51(2):411-412. doi: 10.1016/j.immuni.2019.08.004. Immunity. 2019. PMID: 31433971 No abstract available.

Abstract

We performed an extensive immunogenomic analysis of more than 10,000 tumors comprising 33 diverse cancer types by utilizing data compiled by TCGA. Across cancer types, we identified six immune subtypes-wound healing, IFN-γ dominant, inflammatory, lymphocyte depleted, immunologically quiet, and TGF-β dominant-characterized by differences in macrophage or lymphocyte signatures, Th1:Th2 cell ratio, extent of intratumoral heterogeneity, aneuploidy, extent of neoantigen load, overall cell proliferation, expression of immunomodulatory genes, and prognosis. Specific driver mutations correlated with lower (CTNNB1, NRAS, or IDH1) or higher (BRAF, TP53, or CASP8) leukocyte levels across all cancers. Multiple control modalities of the intracellular and extracellular networks (transcription, microRNAs, copy number, and epigenetic processes) were involved in tumor-immune cell interactions, both across and within immune subtypes. Our immunogenomics pipeline to characterize these heterogeneous tumors and the resulting data are intended to serve as a resource for future targeted studies to further advance the field.

Keywords: cancer genomics; immune subtypes; immuno-oncology; immunomodulatory; immunotherapy; integrative network analysis; tumor immunology; tumor microenvironment.


Conflict of interest statement

DECLARATION OF INTERESTS

The authors declare no competing interests

Figures
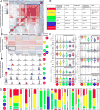
Figure 1
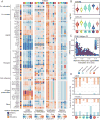
Figure 1. Immune Subtypes in Cancer
A. Expression signature modules and identification of immune subtypes. Top Consensus clustering of the pairwise correlation of cancer immune gene expression signature scores (rows and columns). Five modules of shared associations are indicated by boxes. Middle Representative gene expression signatures from each module (columns), which robustly reproduced module clustering, were used to cluster TGCA tumor samples (rows), resulting in 6 immune subtypes C1-C6 (colored circles). Bottom Distributions of signature scores within the six subtypes (rows), with dashed line indicating the median. B. Key characteristics of immune subtypes. C. Values of key immune characteristics by immune subtype. D. Distribution of immune subtypes within TCGA tumors. The proportion of samples belonging to each immune subtype is shown, with colors as in A. Bar width reflects the number of tumor samples. See also Figure S1 and Table S1.
Figure 2
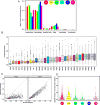
Figure 2. Composition of the Tumor Immune Infiltrate
A. The proportion of major classes of immune cells (from CIBERSORT) within the leukocyte compartment for different immune subtypes. Error bars show the standard error of the mean. B. Leukocyte Fraction (LF) within TCGA tumor types, ordered by median. C. LF (y-axis) vs. non-tumor stromal cellular fraction in the TME (x-axes) for two representative TCGA tumor types: PRAD, (low LF relative to stromal content), and SKCM (high leukocyte fraction in the stroma). Dots represent individual tumor samples. D. The spatial fraction of lymphocyte regions in tissue was estimated using machine learning on digital pathology H&E images (see also (Saltz et al, 2018)).
Figure 3
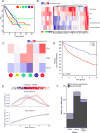
Figure 3. Immune Response and Prognostics
A. Overall survival (OS) by immune subtype. B. Concordance Index (CI) for 5 characteristic immune expression signature scores (Figure 1A) in relation to OS, for immune subtypes and TCGA tumor types. Red denotes higher, and blue lower risk, with an increase in the signature score. C. CI for T-helper scores in relation to OS within immune subtypes. D. Risk stratification from elastic net modeling of immune features. Tumor samples were divided into discovery and validation sets, and an elastic net model was optimized on the discovery set using immune gene signatures, TCR/BCR richness, and neoantigen counts. Kaplan-Meier plot shows the high (red) and low (blue) risk groups from this model as applied to the validation set, p<0.0001 (G-rho family of tests, Harrington and Fleming). E. Prediction vs. outcome from elastic net model in validation set data (from 3D). Top Patient outcomes for each sample (black, survival; red, death) plotted with vertical jitter, along the sample’s model prediction (x-axis). Middle Fractional density of the outcomes plotted against their model predictions. Confidence intervals were generated by bootstrapping with replacement. Bottom LOESS fit of the actual outcomes against the model predictions; narrow confidence bands confirm good prediction accuracy. F. CoxPH models of stage and tumor type (“Tissue”) with (full model) or without (reduced model) the validation set predictions of the elastic net model were compared; the full model significantly outperformed the reduced model in all comparisons (p<0.001; false discovery rate (FDR) BH-corrected). See also Figure S3.
Figure 4
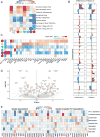
Figure 4. Immune Response and Genome State
A. Correlation of DNA damage measures (rows) with LF. From left to right: all TCGA tumors; averaged over tumor type; grouped by immune subtype. B. LF association with copy number (CN) alterations. Left Differences between observed and expected mean LF in tumors with amplifications, by genomic region. Significant (FDR < 0.01) differences in mean LF are marked with black caps on the profiles. Right Same, for deletions. C. Enrichment and depletion of mutations in driver genes and oncogenic mutations (OM) within immune subtypes, displayed as fold enrichment. Significance was evaluated by the Cochran-Mantel-Haenszel χ2 test, to account for cancer type (white, no significant association) D. Volcano plot showing driver genes and OMs associated with changes in LF, across all tumors (“Pancan”) and within specific tumor types as indicated. X-axis: Multivariate correlation with LF (B-factor), taking into account tumor type and number of missense mutations. Values >0 represent positive correlation with LF and vice versa; Y-axis: -log10(p). Significant events (FDR < 0.1; p<0.003) are in orange, others in gray. E. Left Degree of association between gender for 8 selected immune characteristics (rows) within TCGA tumor types (columns). Blue denotes a higher value in women than in men, and red the opposite. Right Degree of association between the immune characteristics and the first principal component of genetic ancestry in TCGA participants (PC1), reflecting degree of African ancestry. Blue reflects lower values in individuals of African descent. See also Figure S4 and Table S2.
Figure 5
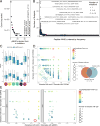
Figure 5. The Tumor-Immune Interface
A. Distribution of the number of pMHCs associated with number of mutations; the 4 pMHCs derived from >40 mutations are labeled. B. Numbers of tumors expressing shared pMHCs. The known cancer genes from which the most frequent pMHCs in the population are derived are indicated C. Top BCR and Bottom TCR diversity measured by Shannon entropy and species richness, logarithmically transformed, and expressed as Z-scores, for immune subtypes. D & E. Co-occurrence of CDR3a-CDR3b (D) and pMHC-CDR3 pairs (E) as a surrogate marker for shared T cell responses. Pairs found in at least 2 samples and meeting statistical significance are plotted, with jitter. X and Y axes indicate how exclusive the pair members are: pairs in the top right typically co-occur, whereas along the axes each member is more often found separately. Size of the circle indicates how many samples that pair was found in. See also Figure S5 and Tables S3, S4 and S5.
Figure 6
Figure 6. Regulation of Immunomodulators
A. From left to right: mRNA expression (median normalized expression levels); expression vs. methylation (gene expression correlation with DNA-methylation beta-value); amplification frequency (the difference between the fraction of samples in which an IM is amplified in a particular subtype and the amplification fraction in all samples); and the deletion frequency (as amplifications) for 75 IM genes by immune subtype. B. Distribution of log-transformed expression levels for IM genes with largest differences across subtypes (by Kruskal-Wallis test). C. CD40 expression is inversely correlated to methylation levels (Affymetrix 450K probe cg25239996, 125 bases upstream of CD40 TSS) in C3. Each point represents a tumor sample, and color indicates point density. D. Proportion of samples in each immune subtype with copy number alterations in CD40 (top) and KIR2DL3 (bottom). The “All” column shows the overall proportion (8461 tumors). See also Figure S6 and Table S6.
Figure 7
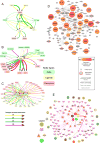
Figure 7. Predicted Networks Modulating the Immune Response to Tumors
TME estimates and tumor cell characteristics were combined with available data on possible physical, signaling and regulatory interactions to predict cellular and molecular interactions involved in tumoral immune responses A. Immune subtype-specific extracellular communication network involving IFN-γ (IFNG, bottom of the diagram), whose expression is concordant with that of its cognate receptors IFNGR1 and IFNGR2 (bottom right and left, respectively), in C2 and C3 (yellow and green arrows, respectively; line thickness indicates strength of association). NK cells (left), which are known to secrete IFN-γ, could be producing IFN-γ in C2 and C3, as the NK cellular fraction is concordant with IFNG expression in both. CXCR3 is known to be expressed on NK cells, and has concordant levels, but only in C3 (green arrow). This is a subnetwork within a larger network constructed by similarly combining annotations of known interactions between ligands, receptors, and particular immune cells types, with evidence for concordance of those components. B. TGF-β subnetwork. Magenta: C6 C. T cell subnetwork. D. Master Regulator (MR) Pan-Immune Network. The network diagram shows 26 MRs “hubs” (filled orange) significantly associated with 15 upstream driver events (orange rings), along with proteins linking the two. The lineage factor VAV1 (on left) is inferred to be a MR by combining predicted protein activity with data on gene expression, protein interactions and somatic alterations. VAV1 activity correlates with LF (degree of correlation depicted as degree of orange). Mutations in HRAS (center of network), are statistically associated with changes in LF. The HRAS and VAV1 proteins are in close proximity on a large network of known protein-protein interactions (not shown), as both can lead to activation of protein MAP2K1, (as shown connecting with dotted lines). Mutations in HRAS are associated (p<0.05) with VAV1 activity, and their link through documented protein interactions implies that HRAS could directly modulate the activity of VAV1. In the diagram, the size of MR nodes represents their ranked activity. Smaller nodes with red borders represent mutated and/or copy-number altered genes statistically associated with one or more MR and LF, with the thickness of the border representing the number of associated MRs; small grey nodes are ‘linker’ proteins. E. Regulators of immune subtypes from SYGNAL-PanImmune Network. Tumor types (octagons) linked through mutations (purple chevrons) to transcription factors (TFs, red triangles) and miRNAs (orange diamonds) that actively regulate the expression of IMs in biclusters associated with a single immune subtype (circles). The network describes predicted causal and mechanistic regulatory relationships linking tumor types through their somatic mutations (yellow edges) which causally modulate the activity of TFs and/or miRNAs (purple edges), which in turn regulate genes (not shown) whose expression is associated with an immune subtype (red edges). For example, RB1 mutations in LIHC (5% of patients) have significant evidence for causally modulating the activity of PRDM1 which in turn regulates genes associated (causal model at least 3 times as likely as alternative models and p-value < 0.05) with C1 and C2. Interactions for this path are bolded.

Similar articles

Cited by

References

    1. Agarwal V, Bell GW, Nam JW, Bartel DP. Predicting effective microRNA target sites in mammalian mRNAs. Elife. 2015;4 - PMC - PubMed
    1. Alvarez MJ, Shen Y, Giorgi FM, Lachmann A, Ding BB, Ye BH, Califano A. Functional characterization of somatic mutations in cancer using network-based inference of protein activity. Nat Genet. 2016;48:838–847. - PMC - PubMed
    1. Amankulor NM, Kim Y, Arora S, Kargl J, Szulzewsky F, Hanke M, Margineantu DH, Rao A, Bolouri H, Delrow J, et al. Mutant IDH1 regulates the tumor-associated immune system in gliomas. Genes Dev. 2017;31:774–786. - PMC - PubMed
    1. Aten JE, Fuller TF, Lusis AJ, Horvath S. Using genetic markers to orient the edges in quantitative trait networks: the NEO software. BMC Syst Biol. 2008;2:34. - PMC - PubMed
    1. Bailey P, Chang DK, Nones K, Johns AL, Patch AM, Gingras MC, Miller DK, Christ AN, Bruxner TJ, Quinn MC, et al. Genomic analyses identify molecular subtypes of pancreatic cancer. Nature. 2016;531:47–52. - PubMed

Publication types

MeSH terms

Grants and funding