Exercise and exercise training-induced increase in autophagy markers in human skeletal muscle
- PMID: 29626392
- PMCID: PMC5889490
- DOI: 10.14814/phy2.13651
Exercise and exercise training-induced increase in autophagy markers in human skeletal muscle
Abstract
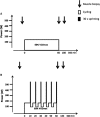
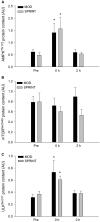
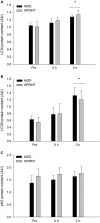
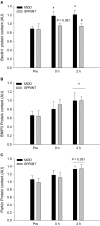
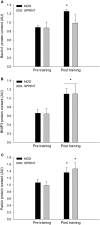
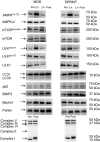
Moderately trained male subjects (mean age 25 years; range 19-33 years) completed an 8-week exercise training intervention consisting of continuous moderate cycling at 157 ± 20 W for 60 min (MOD; n = 6) or continuous moderate cycling (157 ± 20 W) interspersed by 30-sec sprints (473 ± 79 W) every 10 min (SPRINT; n = 6) 3 days per week. Sprints were followed by 3:24 min at 102 ± 17 W to match the total work between protocols. A muscle biopsy was obtained before, immediately and 2 h after the first training session as well as at rest after the training session. In both MOD and SPRINT, skeletal muscle AMPKThr172 and ULKSer317 phosphorylation was elevated immediately after exercise, whereas mTORSer2448 and ULKSer757 phosphorylation was unchanged. Two hours after exercise LC3I, LC3II and BNIP3 protein content was overall higher than before exercise with no change in p62 protein. In MOD, Beclin1 protein content was higher immediately and 2 h after exercise than before exercise, while there were no differences within SPRINT. Oxphos complex I, LC3I, BNIP3 and Parkin protein content was higher after the training intervention than before in both groups, while there was no difference in LC3II and p62 protein. Beclin1 protein content was higher after the exercise training intervention only in MOD. Together this suggests that exercise increases markers of autophagy in human skeletal muscle within the first 2 h of recovery and 8 weeks of exercise training increases the capacity for autophagy and mitophagy regulation. Hence, the present findings provide evidence that exercise and exercise training regulate autophagy in human skeletal muscle and that this in general was unaffected by interspersed sprint bouts.
Keywords: Autophagy; High-intensity exercise training; skeletal muscle.
© 2018 The Authors. Physiological Reports published by Wiley Periodicals, Inc. on behalf of The Physiological Society and the American Physiological Society.
Figures

Similar articles
-
Inclusion of sprints in moderate intensity continuous training leads to muscle oxidative adaptations in trained individuals.Physiol Rep. 2019 Feb;7(4):e13976. doi: 10.14814/phy2.13976. Physiol Rep. 2019. PMID: 30793541 Free PMC article.
-
High-intensity interval training changes the expression of muscle RING-finger protein-1 and muscle atrophy F-box proteins and proteins involved in the mechanistic target of rapamycin pathway and autophagy in rat skeletal muscle.Exp Physiol. 2019 Oct;104(10):1505-1517. doi: 10.1113/EP087601. Epub 2019 Aug 29. Exp Physiol. 2019. PMID: 31357248
-
Regulation of apoptosis and autophagy in mouse and human skeletal muscle with aging and lifelong exercise training.Exp Gerontol. 2018 Oct 1;111:141-153. doi: 10.1016/j.exger.2018.07.011. Epub 2018 Jul 17. Exp Gerontol. 2018. PMID: 30030137
-
Exercise-mediated modulation of autophagy in skeletal muscle.Scand J Med Sci Sports. 2018 Mar;28(3):772-781. doi: 10.1111/sms.12945. Epub 2017 Aug 4. Scand J Med Sci Sports. 2018. PMID: 28685860 Review.
-
Physiological adaptations to interval training and the role of exercise intensity.J Physiol. 2017 May 1;595(9):2915-2930. doi: 10.1113/JP273196. Epub 2016 Dec 7. J Physiol. 2017. PMID: 27748956 Free PMC article. Review.
Cited by
-
Factors Influencing AMPK Activation During Cycling Exercise: A Pooled Analysis and Meta-Regression.Sports Med. 2022 Jun;52(6):1273-1294. doi: 10.1007/s40279-021-01610-x. Epub 2021 Dec 8. Sports Med. 2022. PMID: 34878641
-
The Association Between Regular Physical Exercise, Sleep Patterns, Fasting, and Autophagy for Healthy Longevity and Well-Being: A Narrative Review.Front Psychol. 2021 Dec 2;12:803421. doi: 10.3389/fpsyg.2021.803421. eCollection 2021. Front Psychol. 2021. PMID: 34925198 Free PMC article. Review.
-
The active grandparent hypothesis: Physical activity and the evolution of extended human healthspans and lifespans.Proc Natl Acad Sci U S A. 2021 Dec 14;118(50):e2107621118. doi: 10.1073/pnas.2107621118. Proc Natl Acad Sci U S A. 2021. PMID: 34810239 Free PMC article. Review.
-
New Insights into Molecular Mechanisms Mediating Adaptation to Exercise; A Review Focusing on Mitochondrial Biogenesis, Mitochondrial Function, Mitophagy and Autophagy.Cells. 2021 Oct 2;10(10):2639. doi: 10.3390/cells10102639. Cells. 2021. PMID: 34685618 Free PMC article. Review.
-
Inclusion of sprints in moderate intensity continuous training leads to muscle oxidative adaptations in trained individuals.Physiol Rep. 2019 Feb;7(4):e13976. doi: 10.14814/phy2.13976. Physiol Rep. 2019. PMID: 30793541 Free PMC article.
References
-
- Brandt, N. , Nielsen L., Thiellesen Buch B., Gudiksen A., Ringholm S., Hellsten Y., et al. 2017b. Impact of β‐adrenergic signaling in PGC‐1α‐mediated adaptations in mouse skeletal muscle. Am. J. Physiol. Endocrinol. Metab. 314:E1–E20. - PubMed
Publication types
MeSH terms
LinkOut - more resources
Full Text Sources
Other Literature Sources
Medical
Miscellaneous

