. 2018 Apr 9;33(4):706-720.e9.
doi: 10.1016/j.ccell.2018.03.006. Epub 2018 Apr 2.

lncRNA Epigenetic Landscape Analysis Identifies EPIC1 as an Oncogenic lncRNA that Interacts with MYC and Promotes Cell-Cycle Progression in Cancer

Collaborators, Affiliations

lncRNA Epigenetic Landscape Analysis Identifies EPIC1 as an Oncogenic lncRNA that Interacts with MYC and Promotes Cell-Cycle Progression in Cancer

Zehua Wang et al. Cancer Cell. .

Abstract

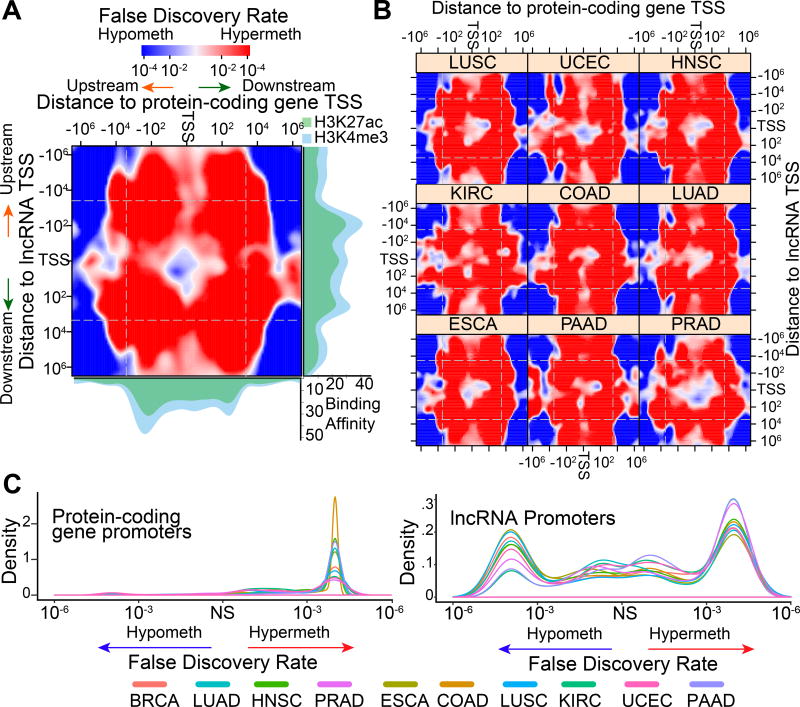
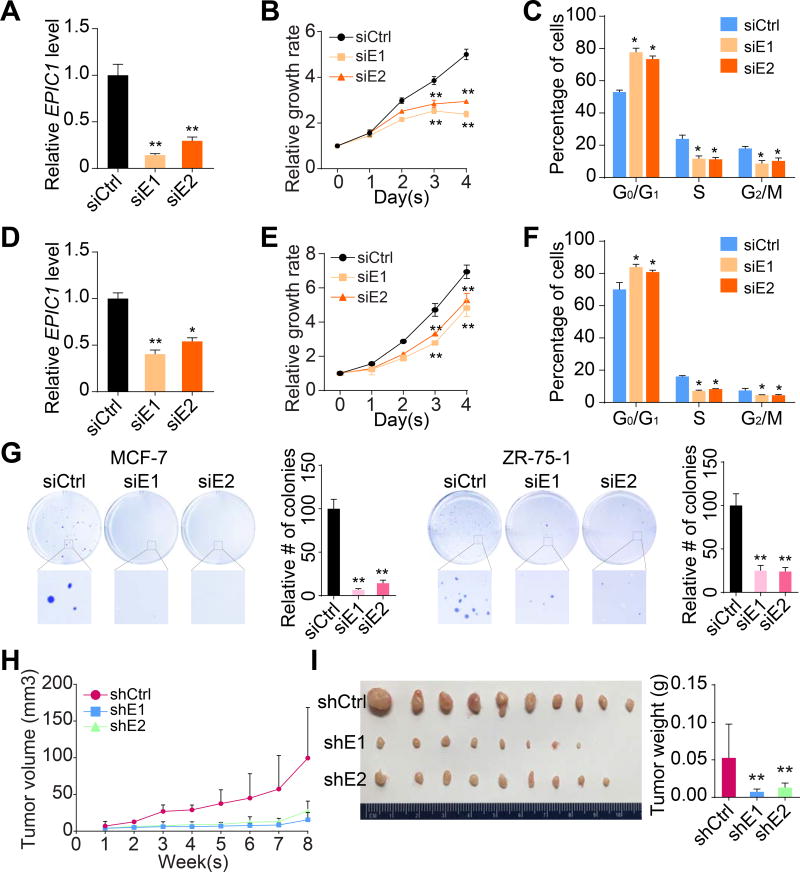
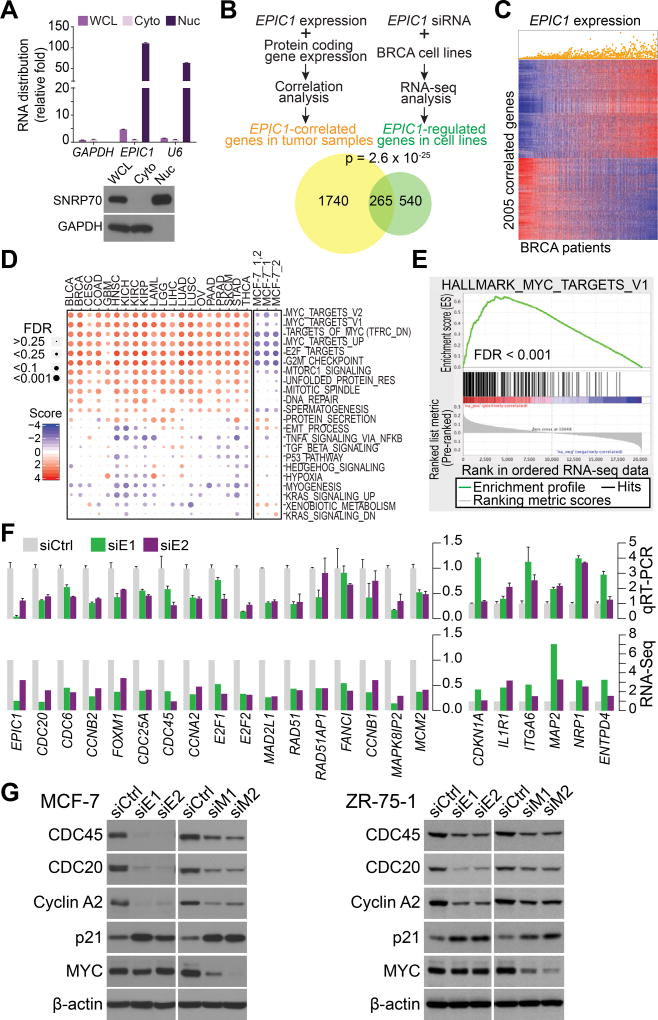
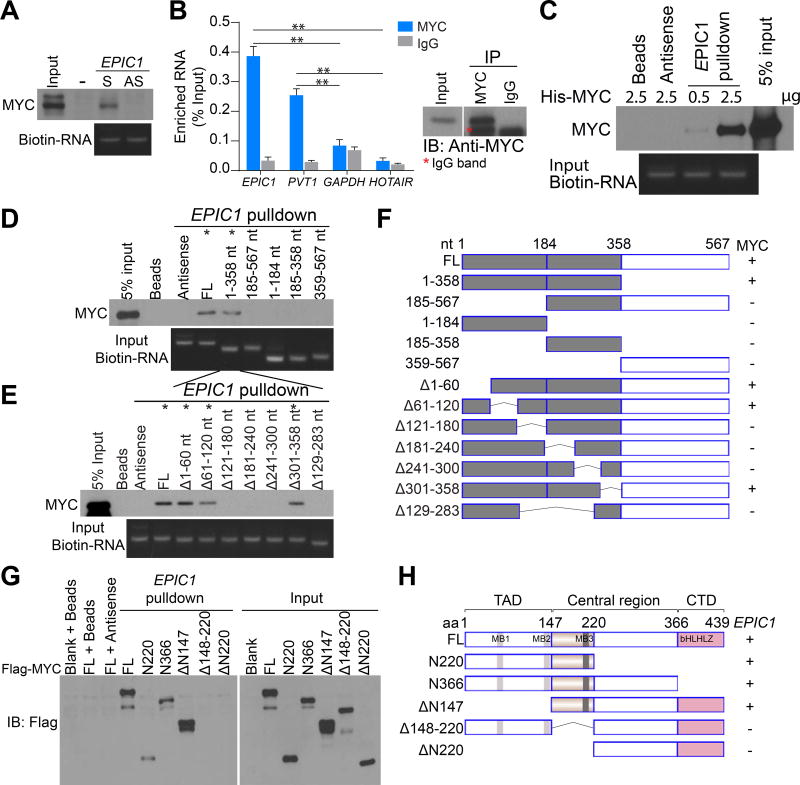
We characterized the epigenetic landscape of genes encoding long noncoding RNAs (lncRNAs) across 6,475 tumors and 455 cancer cell lines. In stark contrast to the CpG island hypermethylation phenotype in cancer, we observed a recurrent hypomethylation of 1,006 lncRNA genes in cancer, including EPIC1 (epigenetically-induced lncRNA1). Overexpression of EPIC1 is associated with poor prognosis in luminal B breast cancer patients and enhances tumor growth in vitro and in vivo. Mechanistically, EPIC1 promotes cell-cycle progression by interacting with MYC through EPIC1's 129-283 nt region. EPIC1 knockdown reduces the occupancy of MYC to its target genes (e.g., CDKN1A, CCNA2, CDC20, and CDC45). MYC depletion abolishes EPIC1's regulation of MYC target and luminal breast cancer tumorigenesis in vitro and in vivo.

Keywords: CIMP; ENSG00000224271; EPIC1; LOC284930; MYC; P21; TCGA pan-cancer; breast cancer; long noncoding RNA.


Figures

Figure 1
Figure 1. LncRNA and protein coding genes have distinct DNA methylation patterns in ten cancer types
(A) Weighted density plot (kde2d.weighted [package: ggtern]) of differential DNA methylation (indicated by FDR values) of 100 windows within ± 1000 kb from TSS sites are shown in breast cancer tissues. The windows are arranged based on their distances to protein coding gene (PCG) TSS (x-axis) and lncRNA gene TSS (y-axis). The promoter region is defined as ± 3 kb (white dashed lines) from TSS. The hypermethylation region in tumor is shown as red, whereas the hypomethylation region is shown as blue. The average H3K27ac and H3K4me3 binding intensities are shown along with the x and y axes. (B) Differential DNA methylation between tumors and matched normal tissues in nine cancer types. (C) Distribution of the differential DNA methylation weighted density values (kde2d.weighted [package: ggtern]) within ± 3 kb region (white dashed lines) of PCG TSS (left) and lncRNA TSS (right) in ten cancer types. NS, not significant. See also Figure S1 and Table S1.
Figure 2
Figure 2. Epigenetic landscape of lncRNAs in cancer
(A) Percentages of significant EA (top panel) or ES (bottom panel) lncRNAs in 20 cancer types. Each pie chart indicates the percentage of each lncRNA epigenetic alteration in each cancer type. Purple indicates EA lncRNAs; green indicates ES lncRNAs. (B, C) Correlation of representative EA (B) or ES (C) lncRNAs’ expression and their DNA methylation level in cancer tissues (red) and normal tissues (blue). y-axis, expression level based on RNA-seq; x-axis, DNA methylation beta value based on Infinium HM450 BeadChip. (D) Expression of the top 20 EA (top panel) and ES (bottom panel) lncRNAs in cancer cell lines from the CCLE database. Each pie chart indicates the percentage of cell lines with the lncRNA expressed (purple, absolute read count > 0) or not expressed (green, absolute read count = 0) in each cancer type. See also Figure S2 and Table S2.
Figure 3
Figure 3. Expression level of EPIC1 is regulated by DNA methylation and associated with poor survival in breast cancer patients
(A) The locations of EPIC1 gene (blue), CpG islands (green) and HM450 probes (red) in GRCh37 reference human genome (chr22:48,027,423–48,251,349). (B) Heatmap with beta value of DNA methylation obtained from three EPIC1 HM450 probes in breast normal tissues and tumors. Three subgroups were identified using a hierarchical clustering analysis in tumors. Black, hypermethylation; green, intermediate; red, hypomethylation. EPIC1’s DNA methylation in normal tissues (blue) is shown as control. Full IDs of EPIC1 HM450 probes are cg10956848, cg14752348 and cg08040429. (C) Relative EPIC1 expression in three subgroups above, compared to the level in normal tissues, respectively. ***p < 0.001. (D) Correlation of EPIC1 expression with EPIC1 DNA methylation status in breast cancer and normal tissues. Probe cg08040429 represents the DNA methylation status. (E) K–M survival curve represents the proportion survival of breast cancer patients with three subgroups above. (F) Forest plot of EPIC1’s association with survival in six independent breast cancer cohorts. EPIC1’s expression is measured by Affymetrix 1563009_at (HG-U133_Plus_2). (G) qRT-PCR analysis of EPIC1 expression in MCF-7 and MB231 cells treated with decitabine (DAC). (H) EPIC1 methylation status detected by the same three probes (B) in breast cancer cell lines treated with decitabine. Beta value score shows the methylation status. (I) Reporter assay of methylated and unmethylated EPIC1 promoters (top). In vitro DNA methylation status of EPIC1 promoters was confirmed by Hpall restriction enzyme (bottom). Error bars indicate mean ± SD, n = 3 for technical replicates. **p < 0.01. NS, not significant. See also Figure S3.
Figure 4
Figure 4. EPIC1 functions as an oncogenic lncRNA in breast cancer
(A–C) qRT-PCR analysis of EPIC1 (A), MTT assay (B), and cell cycle analysis (C) in MCF-7 cells treated with EPIC1 siRNAs (siE1 and siE2). (D–F) qRT-PCR analysis of EPIC1 (D), MTT assay (E), and cell cycle analysis (F) in ZR-75-1 cells treated with EPIC1 siRNAs. (G) Anchorage-independent colony formation assays of MCF-7 (left) and ZR-75-1 (right) cells treated with EPIC1 siRNAs. (H) Quantification of tumor growth in xenograft mouse models bearing with stable EPIC1 knockdown (shE1 and shE2) or control (shCtrl) MCF-7 cells. Error bars indicate means ± SD, n = 3 for technical replicates. *p < 0.05, **p < 0.01. (I) Representative tumor size (left), and quantification of tumor weight (right) from xenograft mouse models. Data are presented as means ± SD (n = 10). **p < 0.01. See also Figure S4.
Figure 5
Figure 5. EPIC1 is a nuclear lncRNA regulating MYC targets expression
(A) qRT-PCR analysis of EPIC1 expression (top) and Western blot (bottom) of subcellular fractionation in MCF-7cells. GAPDH and U6 RNA served as a marker for cytoplasmic and nuclear gene localization, respectively. SNRP70 and GAPDH served as a specific nuclear and cytoplasmic marker to whole cell lysates (WCL), cytoplasmic (Cyto), and nuclear fractionation (Nuc). Error bars indicate mean ± SD, n = 3 for technical replicates. (B) Schematic of the identification of EPIC1 correlated genes in breast tumors from TCGA (yellow), and genes potentially regulated by EPIC1 in MCF-7 cells (green). (C) Co-expression analysis showing that EPIC1 expression is associated with 2005 genes in 559 patients with breast cancer (BRCA). Each column represents one patient. (D) GSEA analysis of the EPIC1-related pathways in 20 cancer types (left panel) and EPIC1 knockdown MCF-7 cells (right panel). The heatmap indicates the GSEA scores. (E) Association between the enrichment of MYC targets and EPIC1 expression in breast tumors by GSEA analysis (D). (F) EPIC1-regulated gene expression by qRT-PCR analysis (top) and RNA-seq (bottom). Error bars indicate mean ± SD, n = 3 for technical replicates. (G) Western blot of MYC-regulated targets in MCF-7 (left) and ZR-75-1 (right) cells treated with EPIC1 and MYC siRNAs. See also Figure S5 and Table S3.
Figure 6
Figure 6. EPIC1 binds directly with MYC
(A) Western blot of MYC proteins retrieved by in vitro-transcribed biotinylated EPIC1 from MCF-7 cell nuclear extracts. Antisense EPIC1 was used as a negative control. S, sense strand; AS, antisense strand. (B) qRT-PCR analysis of EPIC1 and PVT1 enriched by MYC proteins in MCF-7 cells. Western blot of MYC is shown (right). HOTAIR and GAPDH served as negative controls. Error bars indicate mean ± SD, n = 3 for technical replicates. **p < 0.01. (C) Western blot of recombinant MYC proteins retrieved by EPIC1 RNA in in vitro binding assay. EPIC1 antisense was used as a negative control. (D) Western blot of MYC pulled-down by truncated EPIC1. (E) Mapping of the MYC binding region within 1–358 region of EPIC1. (F) Schematic of truncated or deletion mutants of EPIC1. The MYC binding capability is shown (Right). (G) Western blot of truncated MYC proteins retrieved by in vitro-transcribed EPIC1. (H) Schematic of truncated MYC protein. The EPIC1 binding capability is shown. TAD, N-terminal transactivation domain; MB1-3, MYC boxes 1–3; bHLHLZ, basic-helix-loophelix-leucine zipper domain; CTD, C-terminal domain. See also Figure S6.
Figure 7
Figure 7. MYC is required for the regulatory role of EPIC1 in cancer
(A) Reporter assay of CDKN1A (p21) and CCNA2 (Cyclin A2) promoters. (B) Alignment of two biological replicates of MYC ChIP-seq in MCF-7 cells (green) and RNA-seq from siCtrl (blue) and siEPIC1 (red) RNA treated MCF-7 cells. CDKN1A and CCNA2 genomic locus are shown. (C) ChIP-qPCR analysis of MYC occupancy on the promoters of target genes in MCF-7 cells treated with EPIC1 siRNAs. (D, E) Western blot of MYC targets (D) and MTT assay (E) after treatment with MYC siRNAs in MCF-7 cells with stable overexpression of EPIC1 and empty vector. (F, G) Cell cycle analysis (F) and qRT-PCR analysis of EPIC1, CDKN1A, and CCNA2 level (G) in MCF-7 cells transfected with LNA against EPIC1 followed by overexpression of indicated vectors. Error bars indicate mean ± SD, n = 3 for technical replicates. *p < 0.05, **p < 0.01. NS, not significant. See also Figure S7 and Table S4.

Similar articles

Cited by

References

    1. Amati B, Brooks MW, Levy N, Littlewood TD, Evan GI, Land H. Oncogenic activity of the c-Myc protein requires dimerization with Max. Cell. 1993;72:233–245. - PubMed
    1. Amin V, Harris RA, Onuchic V, Jackson AR, Charnecki T, Paithankar S, Lakshmi Subramanian S, Riehle K, Coarfa C, Milosavljevic A. Epigenomic footprints across 111 reference epigenomes reveal tissue-specific epigenetic regulation of lincRNAs. Nat Commun. 2015;6:6370. - PMC - PubMed
    1. Anders S, Huber W. Differential expression analysis for sequence count data. Genome Biol. 2010;11:R106. - PMC - PubMed
    1. Barretina J, Caponigro G, Stransky N, Venkatesan K, Margolin AA, Kim S, Wilson CJ, Lehar J, Kryukov GV, Sonkin D, et al. The Cancer Cell Line Encyclopedia enables predictive modelling of anticancer drug sensitivity. Nature. 2012;483:603–607. - PMC - PubMed
    1. Batista PJ, Chang HY. Long noncoding RNAs: cellular address codes in development and disease. Cell. 2013;152:1298–1307. - PMC - PubMed

Publication types

MeSH terms