. 2018 Apr 5;3(7):e99405.
doi: 10.1172/jci.insight.99405.

Ontogeny and reversal of brain circuit abnormalities in a preclinical model of PCOS

Ontogeny and reversal of brain circuit abnormalities in a preclinical model of PCOS

Mauro Sb Silva et al. JCI Insight. .

Abstract

Androgen excess is a hallmark of polycystic ovary syndrome (PCOS), a prevalent yet poorly understood endocrine disorder. Evidence from women and preclinical animal models suggests that elevated perinatal androgens can elicit PCOS onset in adulthood, implying androgen actions in both PCOS ontogeny and adult pathophysiology. Prenatally androgenized (PNA) mice exhibit a robust increase of progesterone-sensitive GABAergic inputs to gonadotropin-releasing hormone (GnRH) neurons implicated in the pathogenesis of PCOS. It is unclear when altered GABAergic wiring develops in the brain, and whether these central abnormalities are dependent upon adult androgen excess. Using GnRH-GFP-transgenic mice, we determined that increased GABA input to GnRH neurons occurs prior to androgen excess and the manifestation of reproductive impairments in PNA mice. These data suggest that brain circuit abnormalities precede the postpubertal development of PCOS traits. Despite the apparent developmental programming of circuit abnormalities, long-term blockade of androgen receptor signaling from early adulthood rescued normal GABAergic wiring onto GnRH neurons, improved ovarian morphology, and restored reproductive cycles in PNA mice. Therefore, androgen excess maintains changes in female brain wiring linked to PCOS features and the blockade of androgen receptor signaling reverses both the central and peripheral PNA-induced PCOS phenotype.

Keywords: Endocrinology; Fertility; Neuroendocrine regulation; Neuroscience; Sex hormones.


Conflict of interest statement

Conflict of interest: The authors have declared that no conflict of interest exists.

Figures

Figure 1
Figure 1. Androgen excess in PNA mice develops by PND 50.
Circulating testosterone levels from postnatal day (PND) 30 to PND 60 in control (N = 10) and prenatally androgenized (PNA) (N = 9) mice. Data are shown as dot plots for each time point and bars represent mean ± SEM. Dashed blue lines indicate testosterone levels of control mice and red full lines indicate PNA mice. Differences between the groups are reported as *P < 0.05; **P < 0.01 and differences within each groups are reported as #P < 0.05. Data analysis was performed with repeated-measures 2-way ANOVA with Sidak’s post hoc test.
Figure 2
Figure 2. Increased GABAergic contact to GnRH neurons is present in prepubertal PNA mice.
(A) Confocal images of control (N = 4; 45 neurons total) and prenatally androgenized (PNA) (N = 5; 51 neurons total) mice showing GnRH-GFP neurons (green) and vesicular GABA transporter–immunoreactive (VGAT-ir) puncta (red) in the rostral preoptic area. Scale bars: 10 μm. Inset images depict a selected confocal image stack of 1.15 μm thickness illustrating VGAT appositions at the level of GnRH neuron soma and dendrite. Red puncta (VGAT-ir) in close apposition to green GnRH neurons can appear as yellow or with a yellow halo as a result of overlap in confocal projections. White arrowheads point to putative GABA inputs onto the non-spiny GnRH neuron membrane and blue arrowheads show GABA inputs onto spines. Scale bars: 5 μm. (B) Neuronal compartments of bipolar GnRH neurons. Morphological criteria classified the primary dendrite as the thicker dendrite (with largest sectional area leaving the soma) and secondary dendrite as the thinner dendrite. Histograms depict total VGAT-ir apposition density on GnRH neurons (C) and per neuronal compartment (D). Total VGAT-ir apposition density onto the non-spiny GnRH neuron membrane (E), and per neuronal compartment (F). Total VGAT-ir apposition density onto GnRH neuron spines (G), and per neuronal compartment (H). Histogram values are represented as mean ± SEM with dot plot of individual values. *P < 0.05; Mann-Whitney U test. GnRH, gonadotropin-releasing hormone.
Figure 3
Figure 3. Blockade of androgen receptor (AR) signaling reverses GABA-to-GnRH circuit abnormalities in adult PNA mice.
(A) Confocal images of adult diestrus control and prenatally androgenized (PNA) mice showing GnRH-GFP neurons (green) and vesicular GABA transporter–immunoreactive (VGAT-ir) contacts representing GABA inputs (red puncta) in the rostral preoptic area. Red puncta (VGAT-ir) in close apposition to green GnRH neurons can appear as yellow or with a yellow halo as a result of overlap in confocal projections. White arrowheads indicate putative GABAergic inputs to GnRH neurons. Scale bars: 10 μm. (B and E) Projected 3D reconstruction of a GnRH-GFP neuron from an adult PNA mouse illustrating VGAT-ir puncta contacts, with white arrowheads indicating VGAT contact onto non-spiny GnRH neuron membrane, and blue arrowheads indicating inputs onto somatic and dendritic spines. Rotated and zoomed inset images of VGAT contact with a somatic spine (C), front and back views of dendritic spines in the distal dendrite covered with GABA inputs (D and F), and VGAT contacts onto the proximal dendrite of a GnRH neuron (G). (H) Total VGAT-ir density on GnRH neurons of control+oil (N = 6; 61 neurons), control+Flut (N = 7; 72 neurons), PNA+oil (N = 5; 53 neurons), and PNA+Flut (N = 7; 72 neurons) groups. VGAT appositions are shown for each neuronal compartment. (I) Total VGAT apposition density onto non-spiny GnRH neuron membrane. (J) Total VGAT-ir apposition density onto GnRH neuron spines. (K) Number of GnRH neuron spines. Histogram values are represented by mean ± SEM with dot plots of individual values. *P < 0.05; **P < 0.01; ***P < 0.001; ****P < 0.01; 2-way ANOVA with Tukey’s post hoc test. Flut, flutamide; GnRH, gonadotropin-releasing hormone.
Figure 4
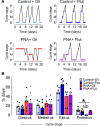
Figure 4. Blockade of androgen receptor (AR) signaling restores reproductive cycles in prenatally androgenized (PNA) mice.
AR signaling blockade was achieved with the administration of flutamide (Flut) s.c. 25 mg/kg/day during 20 days. (A) Representative estrous cycle plots over 20 days from control+oil (N = 6), control+Flut (N = 7), PNA+oil (N = 6), and PNA+Flut (N = 7) groups. P, proestrus; D, diestrus; M, metestrus; E, estrus. (B) Histogram showing mean ± SEM percentage of days spent in each stage of the estrous cycle. ND, not detected.*P < 0.05; F1,23 = 20.5; 2-way ANOVA with Tukey’s post hoc test.
Figure 5
Figure 5. Androgen receptor (AR) blockade improves the recruitment of preovulatory follicles and their features in PNA mice.
Ovarian morphology of adult control and prenatally androgenized (PNA) mice undergoing s.c. injection with oil-vehicle or flutamide (Flut) 25 mg/kg/day from postnatal day (PND) 40 to PND 60. (A) First column: 5-μm-thick ovarian sections from control and PNA mice in diestrus. Corpora lutea are indicated by black asterisks. Scale bars: 500 μm. Second column: representative images of a preovulatory follicle wall from each group; yellow dashed lines delineate the theca cell layer (TLC) from granulosa cell layer (GCL). Scale bars: 50 μm. (B) Total number of primordial, primary, secondary, and antral follicles. (C) Total number of preovulatory follicles and corpora lutea. (D) Percentage of the follicle wall area made up of GCL and TLC from the largest preovulatory follicle. Different letters indicate significant statistical differences with P < 0.05; 2-way ANOVA followed by Tukey’s post hoc test. Histograms show mean ± SEM data from control+oil (N = 6), control+Flut (N = 7), PNA+oil (N = 5), and PNA+Flut (N = 6) groups.
Figure 6
Figure 6. Summary schematic of the ontogeny and plasticity of GABA-to-GnRH neuron circuit abnormalities in a preclinical model of PCOS.
Typically, female androgen levels are relatively low throughout pubertal development and into adulthood, with the exception of a small peripubertal rise (blue line). Elevated perinatal androgens can drive a hyperandrogenic polycystic ovary syndrome (PCOS) condition in adulthood (red line). GABA-to-GnRH neuron circuit abnormalities are present before the onset of puberty in prenatally androgenized PCOS-like mice, suggesting early programming of this aberrant wiring. Adult PCOS-like mice remain with enhanced GABAergic inputs onto GnRH neurons associated with an impairment of steroid hormone–mediated negative feedback, disruption of reproductive cycles, and ovarian dysfunction. Remarkably, GABAergic wiring to GnRH neurons is still plastic through androgen receptor signaling blockade, which also positively impacts reproductive cycles, and improves the recruitment and features of preovulatory follicles. AR, androgen receptor; GnRH, gonadotropin-releasing hormone.

Similar articles

Cited by

References

    1. Lizneva D, Suturina L, Walker W, Brakta S, Gavrilova-Jordan L, Azziz R. Criteria, prevalence, and phenotypes of polycystic ovary syndrome. Fertil Steril. 2016;106(1):6–15. doi: 10.1016/j.fertnstert.2016.05.003. - DOI - PubMed
    1. Rotterdam ESHRE/ASRM-Sponsored PCOS Consensus Workshop Group. Revised 2003 consensus on diagnostic criteria and long-term health risks related to polycystic ovary syndrome. Fertil Steril. 2004;81(1):19–25. doi: 10.1016/j.fertnstert.2003.10.004. - DOI - PubMed
    1. Dumesic DA, Oberfield SE, Stener-Victorin E, Marshall JC, Laven JS, Legro RS. Scientific statement on the diagnostic criteria, epidemiology, pathophysiology, and molecular genetics of polycystic ovary syndrome. Endocr Rev. 2015;36(5):487–525. doi: 10.1210/er.2015-1018. - DOI - PMC - PubMed
    1. Rebar R, Judd HL, Yen SS, Rakoff J, Vandenberg G, Naftolin F. Characterization of the inappropriate gonadotropin secretion in polycystic ovary syndrome. J Clin Invest. 1976;57(5):1320–1329. doi: 10.1172/JCI108400. - DOI - PMC - PubMed
    1. Pastor CL, Griffin-Korf ML, Aloi JA, Evans WS, Marshall JC. Polycystic ovary syndrome: evidence for reduced sensitivity of the gonadotropin-releasing hormone pulse generator to inhibition by estradiol and progesterone. J Clin Endocrinol Metab. 1998;83(2):582–590. - PubMed

Publication types

MeSH terms

Grants and funding

14/077