. 2018 May;28(5):676-688.
doi: 10.1101/gr.231449.117. Epub 2018 Apr 4.

Integrated analysis sheds light on evolutionary trajectories of young transcription start sites in the human genome

Affiliations

Integrated analysis sheds light on evolutionary trajectories of young transcription start sites in the human genome

Cai Li et al. Genome Res. 2018 May.

Abstract

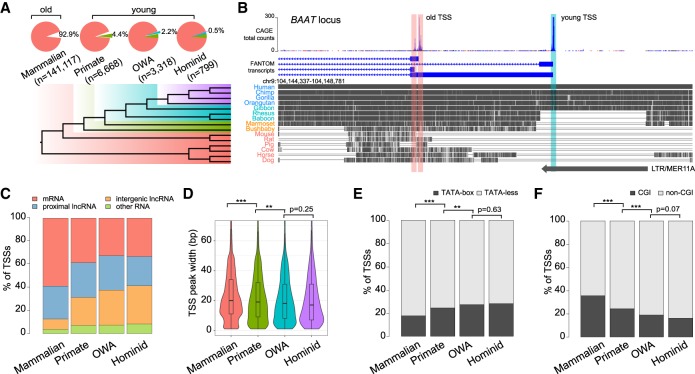
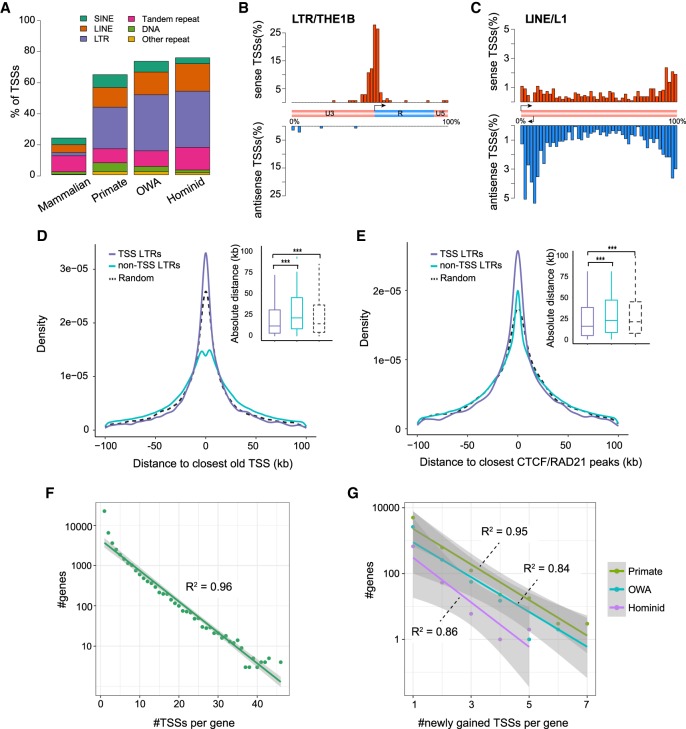
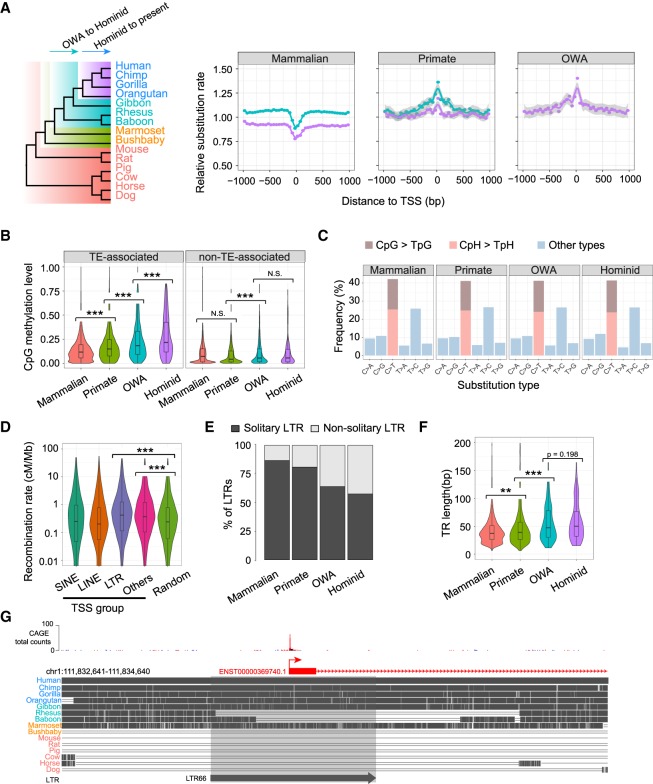
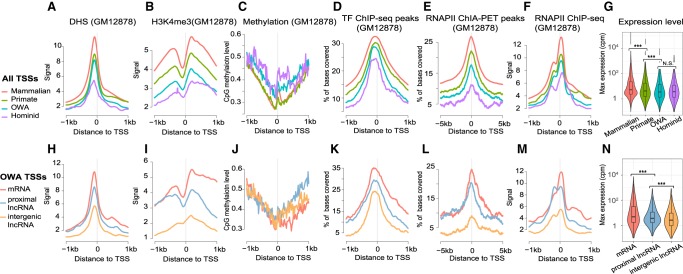
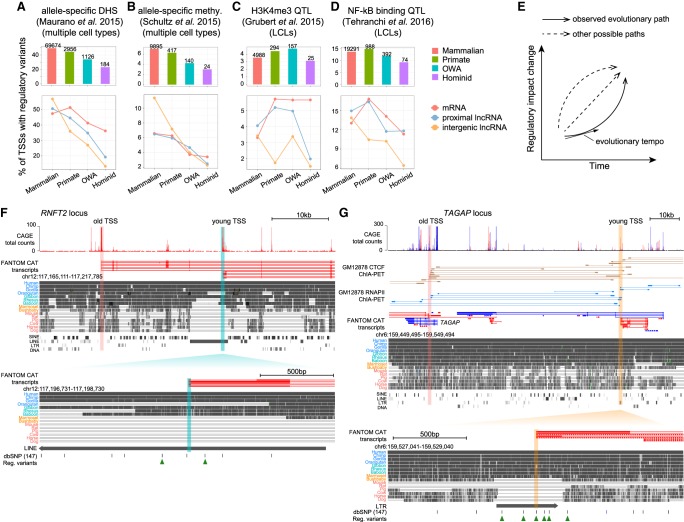
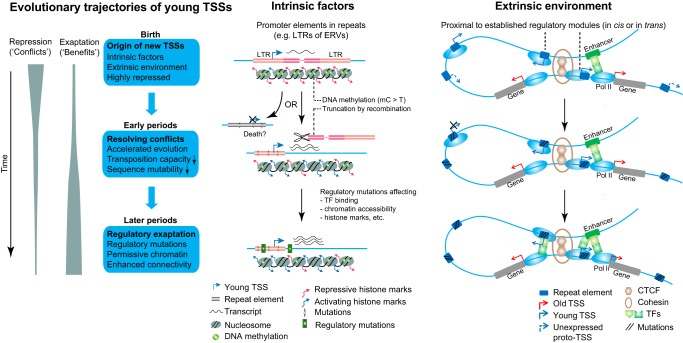
Understanding the molecular mechanisms and evolution of the gene regulatory system remains a major challenge in biology. Transcription start sites (TSSs) are especially interesting because they are central to initiating gene expression. Previous studies revealed widespread transcription initiation and fast turnover of TSSs in mammalian genomes. Yet, how new TSSs originate and how they evolve over time remain poorly understood. To address these questions, we analyzed ∼200,000 human TSSs by integrating evolutionary (inter- and intra-species) and functional genomic data, particularly focusing on evolutionarily young TSSs that emerged in the primate lineage. TSSs were grouped according to their evolutionary age using sequence alignment information as a proxy. Comparisons of young and old TSSs revealed that (1) new TSSs emerge through a combination of intrinsic factors, like the sequence properties of transposable elements and tandem repeats, and extrinsic factors such as their proximity to existing regulatory modules; (2) new TSSs undergo rapid evolution that reduces the inherent instability of repeat sequences associated with a high propensity of TSS emergence; and (3) once established, the transcriptional competence of surviving TSSs is gradually enhanced, with evolutionary changes subject to temporal (fewer regulatory changes in younger TSSs) and spatial constraints (fewer regulatory changes in more isolated TSSs). These findings advance our understanding of how regulatory innovations arise in the genome throughout evolution and highlight the genomic robustness and evolvability in these processes.


Figures

Figure 1.
Figure 1.
Classification of human transcription start sites (TSSs) by evolutionary age. (A) (Top) Statistics of four TSS groups defined by sequence age using genomic alignments. (Bottom) Phylogeny with colors indicating the corresponding evolutionary age of each group. OWA = Old World anthropoids. (B) Example BAAT locus containing two “mammalian” TSSs (“old”; red shade) and one “OWA” TSS (“young”; cyan shade). (Top) FANTOM5 CAGE data and annotations indicating different TSSs. (Middle) Multiple genome alignments with gray blocks representing regions of sequence homology in different species. (Bottom) An annotated long tandem repeat (LTR) element overlapping with the young TSS. (C) Composition of associated transcript types in each TSS group. (D) Violin-box plots for TSS peak widths of each TSS group. (E) Proportions of TATA-box-containing and TATA-less TSSs. (F) Proportions of CGI-associated and non-CGI-associated TSSs. Statistical significances in D were calculated by one-tailed Wilcoxon rank-sum tests; statistical significances in E and F by Fisher's exact tests; (**) P < 0.01, (***) P < 0.001.
Figure 2.
Figure 2.
Intrinsic and extrinsic factors contributing to the origin of new TSSs. (A) Composition of major repeat families in four TSS groups. We considered the nearest repeat element within TSS ± 100 bp. (B) Distribution of young TSSs plotted against the consensus LTR/THE1B element. Schematic of THE1B indicates the original TSS, U3, R, and U5 regions for the element. (C) Distribution of young TSSs plotted against the consensus LINE/L1 element. Schematic of the L1 structure indicates the original sense and antisense TSSs at the 5′ end. (D) Comparison of distances of TSS-associated and non-TSS-associated LTRs to the closest old TSSs. Distances of random intervals to the closest old TSSs are also provided for comparison. Inset shows a box plot of the same distribution. (E) Comparison of distances of TSS-associated and non-TSS-associated LTRs to the closest CTCF or RAD21 ChIA-PET peaks (from GM12878; only mammalian-conserved peaks were used). Distances of random intervals are calculated in a similar manner to panel D. Inset shows a box plot of the same distribution. (F) Exponential approximation for the number of genes with a certain number of TSSs and number of TSSs per gene, based on data of all TSSs. R2 is the coefficient of determination for the linear regression. Gray shade indicates the 95% confidence interval. (G) Exponential approximation for number of genes and number of newly gained TSSs per gene, based on data of newly emerged TSSs in three periods. Statistical significances in D and E were calculated by one-tailed Wilcoxon rank-sum tests; (***) P < 0.001.
Figure 3.
Figure 3.
Rapid sequence evolution of young TSSs. (A) (Left) Phylogeny of genomes used for evolutionary rate analysis, with arrows indicating the two considered periods. (Right) Distributions of relative substitution rates (normalized by genomic average) inferred from genomic alignments for three TSS groups using 50-bp bins along TSS ± 1 kb. The curve colors correspond to the two periods highlighted in the phylogeny. Best-fit curves were estimated by “loess,” and gray shades indicate 95% confidence intervals. (B) Violin-box plots for germline DNA methylation levels (a male germline data set from Guo et al. 2015) for different TSS groups. For each TSS, the average methylation level of CpGs was calculated for TSS ± 1 kb. (C) Frequencies of nucleotide substitution types in different TSS groups, based on the data from the 1000 Genomes Project. (D) Violin-box plots of recombination rates among TSSs associated with different types of retrotransposons and random genomic background. The recombination rate of each TSS was defined as the average rate for TSS ± 1 kb. Background recombination rates were generated for randomly selected 2-kb windows in the human genome. (E) The fraction of solitary LTRs in four TSS groups. (F) Violin-box plots of tandem repeat (TR) lengths in the four TSS groups. (G) Genome browser view depicting a putative TSS death event around an LTR66 element in the lineages of rhesus and baboon. Statistical significances in B, D, and F were calculated by one-tailed Wilcoxon rank-sum tests. (**) P < 0.01, (***) P < 0.001, (N.S.) not significant.
Figure 4.
Figure 4.
Distinct functional signatures in different TSS groups. (A) Metaprofiles of DHS signals for four TSS groups using 20-bp bins along TSS ± 1 kb (same bin sizes for other panels). (B) Metaprofiles of H3K4me3 signals. (C) Metaprofiles of CpG methylation levels. (D) Metaprofiles of coverage ratio by TF ChIP-seq peaks. Previously called peaks of 88 TF ChIP-seq data sets from ENCODE were merged, and for every bin of each TSS locus we calculated the proportion of bases covered by merged peaks. (E) Metaprofiles of coverage ratio by RNAP II ChIA-PET peaks. (F) Metaprofiles of RNAP II ChIP-seq signals. (G) Violin-box plots of maximum expression levels of TSSs across primary cell samples, based on the data from FANTOM. (HN) As in AG, but specifically for the “OWA” TSS subgroups of different transcript types. All functional genomic data except the expression data are for the GM12878 cell line.
Figure 5.
Figure 5.
Temporal and spatial constraints on the regulatory evolution of young TSSs. (A) (Top) Proportion of TSSs harboring regulatory variants associated with allele-specific DHS within TSS ± 1 kb for each TSS group; numbers above bars indicate the numbers of TSSs with regulatory variants. (Bottom) Proportions of TSSs harboring regulatory variants in different TSS subgroups, defined by transcript type. (B) Proportion of TSSs harboring variants associated with allele-specific methylation within TSS ± 1 kb. (C) Proportion of TSSs harboring H3K4me3 QTLs within TSS ± 1 kb. Data generated from lymphoblastoid cell lines (LCLs). (D) Proportion of TSSs harboring NF-kb complex binding (RELA ChIP) QTLs within TSS ± 1 kb. (E) Schematic illustration depicting different possible paths for regulatory evolution of young TSSs. (F) Genome browser view of a young TSS cis-proximal to old TSSs. (Top) FANTOM CAT transcript models (red for forward-strand, blue for reverse-strand); genomic alignments and TE annotations obtained from the UCSC Genome Browser. (Bottom) Enlarged region of an “OWA” TSS inside a LINE element. Beneath the alignments are the common SNPs (allele frequency ≥0.01) from dbSNP database and SNPs associated with regulatory variation. (G) A young TSS trans-proximal to old TSSs. (Top) Similar to F but with additional CTCF and RNAP II ChIA-PET data for GM12878 cell line. (Bottom) Enlarged region of the young TSS. Below the alignments are the common SNPs (allele frequency ≥0.01) and regulatory variants.
Figure 6.
Figure 6.
Proposed evolutionary model of young TSSs. The origin of new TSSs is promoted by sequence-intrinsic and -extrinsic factors. In the early phase, newly emerged TSSs undergo rapid sequence evolution, allowing genomic conflicts associated with repeats to be resolved. In the later phases, surviving TSSs gradually gain mutations in surrounding regions which could increase their regulatory capacity.

Similar articles

Cited by

References

    1. The 1000 Genomes Project Consortium. 2012. An integrated map of genetic variation from 1,092 human genomes. Nature 491: 56–65. - PMC - PubMed
    1. Aken BL, Achuthan P, Akanni W, Amode MR, Bernsdorff F, Bhai J, Billis K, Carvalho-Silva D, Cummins C, Clapham P, et al. 2017. Ensembl 2017. Nucleic Acids Res 45: D635–D642. - PMC - PubMed
    1. Albert FW, Kruglyak L. 2015. The role of regulatory variation in complex traits and disease. Nat Rev Genet 16: 197–212. - PubMed
    1. Ashkenazy H, Penn O, Doron-Faigenboim A, Cohen O, Cannarozzi G, Zomer O, Pupko T. 2012. FastML: a web server for probabilistic reconstruction of ancestral sequences. Nucleic Acids Res 40: W580–W584. - PMC - PubMed
    1. Attig J, Ruiz de Los Mozos I, Haberman N, Wang Z, Emmett W, Zarnack K, Konig J, Ule J. 2016. Splicing repression allows the gradual emergence of new Alu-exons in primate evolution. eLife 5: e19545. - PMC - PubMed

Publication types