. 2018 Jul 1;164(1):115-128.
doi: 10.1093/toxsci/kfy070.

Impact of CAR Agonist Ligand TCPOBOP on Mouse Liver Chromatin Accessibility

Affiliations

Impact of CAR Agonist Ligand TCPOBOP on Mouse Liver Chromatin Accessibility

Nicholas J Lodato et al. Toxicol Sci. .

Abstract

Activation of the nuclear receptor and transcription factor CAR (Nr1i3) by its specific agonist ligand TCPOBOP (1, 4-bis[2-(3, 5-dichloropyridyloxy)]benzene) dysregulates hundreds of genes in mouse liver and is linked to male-biased hepatocarcinogenesis. To elucidate the genomic organization of CAR-induced gene responses, we investigated the distribution of TCPOBOP-responsive RefSeq coding and long noncoding RNA (lncRNA) genes across the megabase-scale topologically associating domains (TADs) that segment the genome, and which provide a structural framework that functionally constrains enhancer-promoter interactions. We show that a subset of TCPOBOP-responsive genes cluster within TADs, and that TCPOBOP-induced genes and TCPOBOP-repressed genes are often found in different TADs. Further, using DNase-seq and DNase hypersensitivity site (DHS) analysis, we identified several thousand genomic regions (ΔDHS) where short-term exposure to TCPOBOP induces localized changes (increases or decreases) in mouse liver chromatin accessibility, many of which cluster in TADs together with TCPOBOP-responsive genes. Sites of chromatin opening were highly enriched nearby genes induced by TCPOBOP and chromatin closing was highly enriched nearby genes repressed by TCPOBOP, consistent with TCPOBOP-responsive ΔDHS serving as enhancers and promoters that positively regulate CAR-responsive genes. Gene expression changes lagged behind chromatin opening or closing for a subset of TCPOBOP-responsive ΔDHS. ΔDHS that were specifically responsive to TCPOBOP in male liver were significantly enriched for genomic regions with a basal male bias in chromatin accessibility; however, the male-biased response of hepatocellular carcinoma-related genes to TCPOBOP was not associated with a correspondingly male-biased ΔDHS response. These studies elucidate the genome-wide organization of CAR-responsive genes and of the thousands of associated genomic sites where TCPOBOP exposure induces both rapid and persistent changes in chromatin accessibility.


Figures
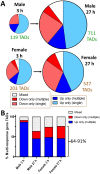
Figure 1.
Figure 1.
TCPOBOP-responsive genes cluster in TADs. A, Distribution of the number of TADs that contain either a single TCPOBOP-responsive gene or multiple TCPOBOP-responsive genes in livers of mice treated with TCPOBOP for 3 or 27 h. Blue, TADs that contain gene(s) upregulated by TCPOBOP; red, TADs that contain gene(s) downregulated by TCPOBOP; gray, TADs that contain both upregulated genes and downregulated genes. Darker shades of blue and red indicate TADs with multiple TCPOBOP-responsive genes all responding in the same direction, as indicated. Pie chart sections are ordered as follows (counterclockwise): mixed, down (multiple, single), up (multiple, single). B, Percent of TADs with multiple TCPOBOP-responsive genes where all of the responsive genes in the TAD are either upregulated (blue), downregulated (red), or show a mixture of up and downregulatory responses (gray). See Supplementary Table 2B for a full listing of TCPOBOP-responsive TADs and the corresponding numbers of up and downregulated genes in each exposure group, and see Supplementary Table 4 for aggregate gene and TAD numbers (The reader is referred to the web version of this article to clarify the references to color in this figure legend).
Figure 2.
Figure 2.
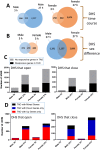
TCPOBOP-induced chromatin opening and closing: ΔDHS regions. A, Venn diagrams showing overlap of TCPOBOP-induced ΔDHS regions after 3 h versus 27 h exposure. B, Overlap of ΔDHS regions between male and female mouse liver at each TCPOBOP time point. ΔDHS regions were identified for each TCPOBOP exposure condition based on the merged list of 60 739 DHS regions (Supplementary Table 1B). Only ΔDHS that responded in the same direction at the time points compared (A) or in the comparison of sexes (B) were considered overlapping (eg, ΔDHS that open in males at 3 h and ΔDHS that open in males at 27 h; ΔDHS that close in males at 3 h and ΔDHS that close in males at 27 h, etc.). Up to 3 ΔDHS in each dataset showed inconsistent responses to TCPOBOP at 3 h versus 27 h (A), or between male and female livers (B), and were excluded from the numbers shown. C, ΔDHS regions shown in (A) are separated into sets of ΔDHS that open (left) or close (right) for each TCPOBOP exposure, and are counted based on whether they do (black) or do not (gray) contain at least one TCPOBOP-responsive gene at that time point whose transcription start site is in the same TAD as the ΔDHS region. D, ΔDHS regions that open or close and contain at least one TCPOBOP-responsive gene (black bars in C) are colored to indicate whether the TCPOBOP-responsive genes within the same TAD as the ΔDHS are all upregulated (red), downregulated (blue), or mixed with regard to the directionality of their responses to TCPOBOP (black). See Supplementary Table 5 for a more detailed listing (The reader is referred to the web version of this article to clarify the references to color in this figure legend).
Figure 3.
Figure 3.
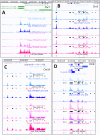
ΔDHS that respond to TCPOBOP, visualized in genome browser. A, Six strong ΔDHS upstream of Cyp2b10 are induced by TCPOBOP at both 3 and 27 h, in both male and female liver. Cyp2b10 and lnc_5998 (green; both isoforms are shown) are strongly induced under all 4 TCPOBOP conditions. B, 5 to 6 ΔDHS in the vicinity of Gstm3 are induced by TCPOBOP at 27 h, but not at 3 h, in both male and female liver. C, Many ΔDHS open in the vicinity of Cyp2c53-ps and Cyp2c29, which are both induced by all 4 TCPOBOP exposures. D, ΔDHS that close at 27 h, but not after 3 h TCPOBOP treatment, surrounding metallothionein genes Mt1 and Mt2 and two nearby lncRNA genes. At the 27 h time point, Mt1 and Mt2 are repressed in both male and female liver, lnc_7332 is repressed in female liver only, and lnc_7334 is repressed in male liver only. None of the four genes are repressed at the 3 h TCPOBOP time point, consistent with the delayed closing of the ΔDHS shown here. Six browser tracks with reads-in-peaks normalized Wig file DNase-seq data (see Materials and Methods) are shown in each panel: vehicle-treated controls and 3 h and 27 h TCPOBOP-treated males (blue) and females (pink/red), as marked. In panels B, C, and D, black, red, and blue bars above each track indicate locations of DHS discovered by MACS2 analysis. Static DHS are marked in black bars. Dark red and dark blue bars indicate robust ΔDHS that open and close, respectively; light red and light blue bars indicate standard ΔDHS that open and close, respectively (see Materials and Methods). Bottom track in each panel marks DHS regions identified in untreated male and female mouse liver in our prior study (Ling, et al., 2010), many of which match the DHS shown in the tracks above, indicating that these DHS are highly reproducible (The reader is referred to the web version of this article to clarify the references to color in this figure legend).
Figure 4.
Figure 4.
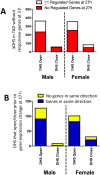
TCPOBOP-induced DHS opening, or closing, may precede gene activation or repression. A, ΔDHS induced by 3 h TCPOBOP exposure that do not have a 3 h TCPOBOP-responsive gene in the same TAD (gray bars in Figure 2 C) were analyzed to determine whether the TADs containing those ΔDHS either do (white bars) or do not (red bars) contain one or more TCPOBOP-responsive genes at the 27 h time point. B, The 3 h ΔDHS whose associated gene(s) in the same TAD show a delayed response to TCPOBOP (white bars in A) were analyzed to determine whether (blue bars) or not (yellow bars), for one or more genes in the TAD, DHS opening at 27 h is associated with gene induction, and DHS closing at 27 h is associated with gene repression (The reader is referred to the web version of this article to clarify the references to color in this figure legend).
Figure 5.
Figure 5.
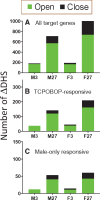
ΔDHS mapping to gene targets of regulators of HCC. Shown is the number of ΔDHS that map to gene targets of 10 CAR-dependent upstream regulators of liver carcinogenesis described previously (Lodato, et al., 2017). Despite the strong male bias in the TCPOBOP responsiveness of the gene targets of these upstream regulators (Lodato, et al., 2017), there was no significant sex bias in the number of ΔDHS that mapped to any of the following three gene sets (see text): A, the set of all downstream target genes of these 10 regulators (n = 4336 genes); B, the set of all downstream targets that are TCPOBOP-responsive (n = 378 genes); C, the set of all downstream targets induced by 27 h TCPOBOP exposure in male liver but not in female liver (n = 153 genes) (Supplementary Table 3) (Lodato, et al., 2017).
Figure 6.
Figure 6.
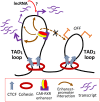
Impact of TAD segmentation of the genome on the selection of genes for CAR-induced transcriptional activation. Shown is a model with two adjacent TADs. TAD1 contains a cluster of 3 TCPOBOP/CAR-inducible genes, which may be activated by CAR to different extents, as shown. TAD2 contains two genes that are not subject to the stimulatory effects of the enhancer DHS in TAD1 when it is bound by a CAR-RXR heterodimer, due to the strong insulation imposed by the TAD’s looped DNA structure (black loop). This insulation is apparent, even when the gene promoters in TAD2 are closer, in linear DNA length, to the CAR-bound enhancer DHS than the CAR target genes in TAD1. A single enhancer DHS may activate multiple CAR-responsive promoters within a TAD, as shown, and individual promoters may be activated through the cooperative actions of multiple enhancer DHS (not illustrated). Further constraints on enhancer-promoter interactions may be imposed by intra-TAD (subTAD) looped domains (not shown). TADs are formed by DNA loop extrusion through the ring-shaped cohesin complex, which associates with the sequence-specific DNA-binding protein CTCF, two copies of which are bound at directionally oriented binding sites near the base of the loop, as shown. Mouse liver TADs have a median length of ∼400 kb but may vary widely in size, as illustrated by the two TADs in this model. CAR target genes include many lncRNAs (Lodato, et al., 2017), some of which may modulate transcription of other CAR targets, either in cis (red arrow), or in trans (The reader is referred to the web version of this article to clarify the references to color in this figure legend).

Similar articles

Cited by

References

    1. Baldwin W. S., Roling J. A. (2009). A concentration addition model for the activation of the constitutive androstane receptor by xenobiotic mixtures. Toxicol. Sci. 107, 93–105. - PMC - PubMed
    1. Bonev B., Cavalli G. (2016). Organization and function of the 3D genome. Nat. Rev. Genet. 17, 661–678. - PubMed
    1. Bowers E. C., McCullough S. D. (2017). Linking the epigenome with exposure effects and susceptibility: The epigenetic seed and soil model. Toxicol. Sci. 155, 302–314. - PMC - PubMed
    1. Burris H. H., Baccarelli A. A. (2014). Environmental epigenetics: From novelty to scientific discipline. J. Appl. Toxicol. 34, 113–116. - PMC - PubMed
    1. Casati L., Sendra R., Sibilia V., Celotti F. (2015). Endocrine disrupters: The new players able to affect the epigenome. Front. Cell Dev. Biol. 3, 37.. - PMC - PubMed

Publication types