

The SAGA/TREX-2 subunit Sus1 binds widely to transcribed genes and affects mRNA turnover globally
- PMID: 29598828
- PMCID: PMC5875001
- DOI: 10.1186/s13072-018-0184-2
The SAGA/TREX-2 subunit Sus1 binds widely to transcribed genes and affects mRNA turnover globally
Abstract
Background: Eukaryotic transcription is regulated through two complexes, the general transcription factor IID (TFIID) and the coactivator Spt-Ada-Gcn5 acetyltransferase (SAGA). Recent findings confirm that both TFIID and SAGA contribute to the synthesis of nearly all transcripts and are recruited genome-wide in yeast. However, how this broad recruitment confers selectivity under specific conditions remains an open question.
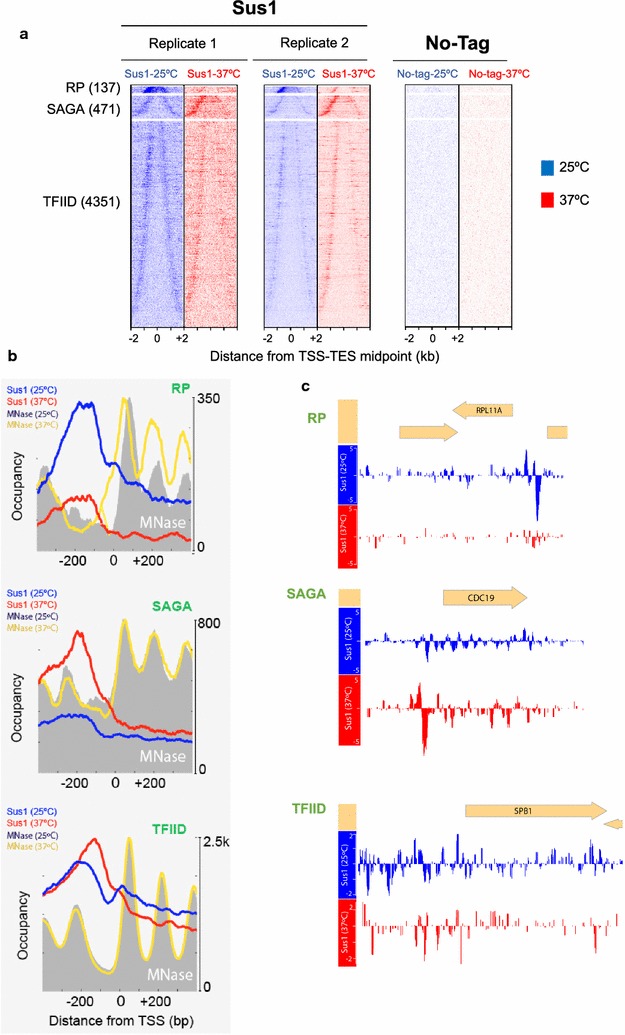
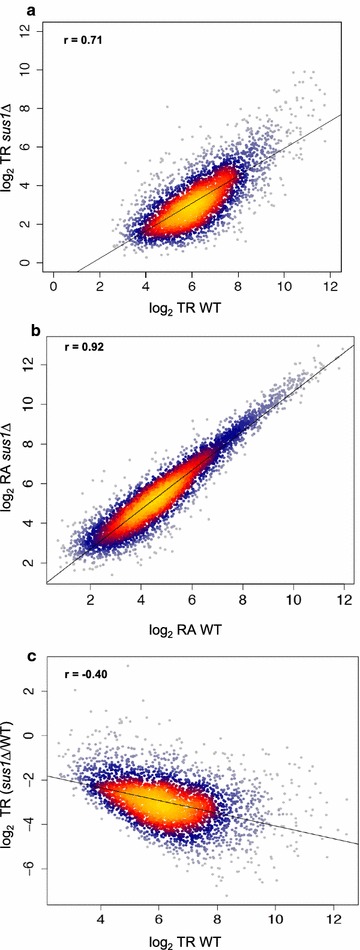
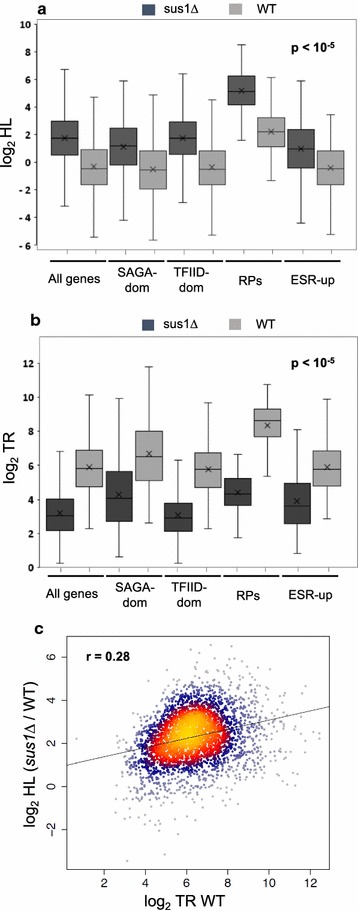
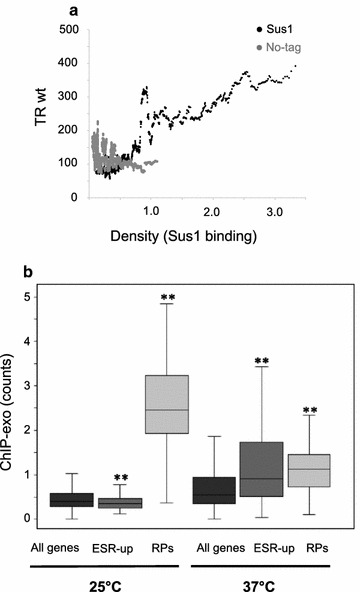
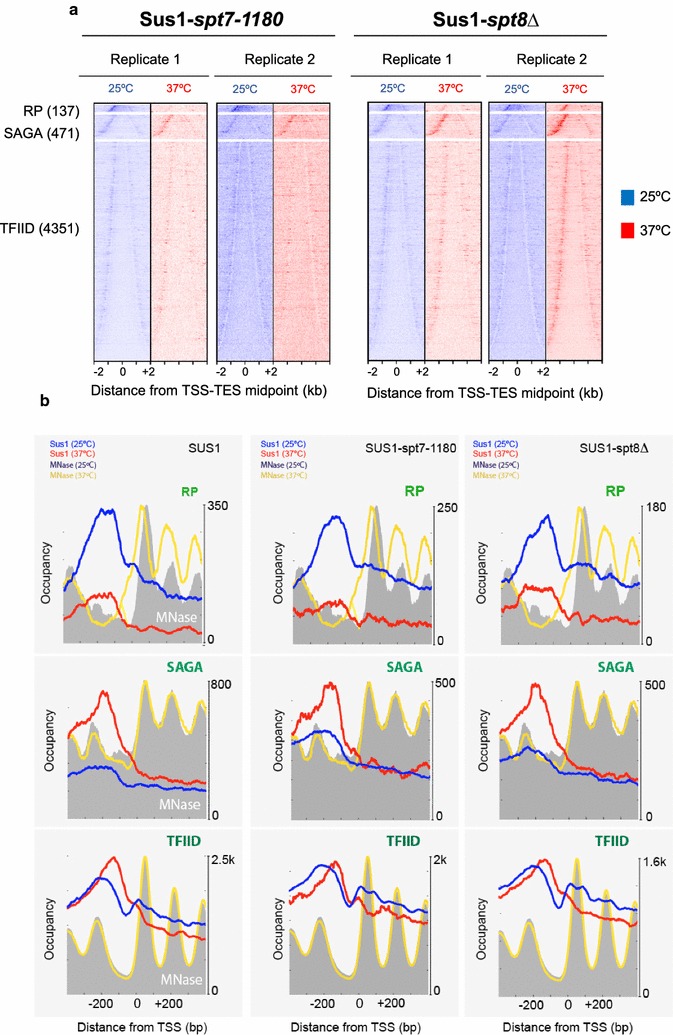
Results: Here we find that the SAGA/TREX-2 subunit Sus1 associates with upstream regulatory regions of many yeast genes and that heat shock drastically changes Sus1 binding. While Sus1 binding to TFIID-dominated genes is not affected by temperature, its recruitment to SAGA-dominated genes and RP genes is significantly disturbed under heat shock, with Sus1 relocated to environmental stress-responsive genes in these conditions. Moreover, in contrast to recent results showing that SAGA deubiquitinating enzyme Ubp8 is dispensable for RNA synthesis, genomic run-on experiments demonstrate that Sus1 contributes to synthesis and stability of a wide range of transcripts.
Conclusions: Our study provides support for a model in which SAGA/TREX-2 factor Sus1 acts as a global transcriptional regulator in yeast but has differential activity at yeast genes as a function of their transcription rate or during stress conditions.
Keywords: ChIP-exo; GRO; SAGA; Sus1; Transcription.
Figures
Similar articles
-
Mutational uncoupling of the role of Sus1 in nuclear pore complex targeting of an mRNA export complex and histone H2B deubiquitination.J Biol Chem. 2009 May 1;284(18):12049-56. doi: 10.1074/jbc.M900502200. Epub 2009 Mar 5. J Biol Chem. 2009. PMID: 19269973 Free PMC article.
-
The mRNA export factor Sus1 is involved in Spt/Ada/Gcn5 acetyltransferase-mediated H2B deubiquitinylation through its interaction with Ubp8 and Sgf11.Mol Biol Cell. 2006 Oct;17(10):4228-36. doi: 10.1091/mbc.e06-02-0098. Epub 2006 Jul 19. Mol Biol Cell. 2006. PMID: 16855026 Free PMC article.
-
Sus1 is recruited to coding regions and functions during transcription elongation in association with SAGA and TREX2.Genes Dev. 2008 Oct 15;22(20):2811-22. doi: 10.1101/gad.483308. Genes Dev. 2008. PMID: 18923079 Free PMC article.
-
A tale of coupling, Sus1 function in transcription and mRNA export.RNA Biol. 2009 Apr-Jun;6(2):141-4. doi: 10.4161/rna.6.2.7793. Epub 2009 Apr 7. RNA Biol. 2009. PMID: 19246994 Review.
-
Sus1/ENY2: a multitasking protein in eukaryotic gene expression.Crit Rev Biochem Mol Biol. 2012 Nov-Dec;47(6):556-68. doi: 10.3109/10409238.2012.730498. Epub 2012 Oct 12. Crit Rev Biochem Mol Biol. 2012. PMID: 23057668 Review.
Cited by
-
SAGA Complex Subunit Hfi1 Is Important in the Stress Response and Pathogenesis of Cryptococcus neoformans.J Fungi (Basel). 2023 Dec 15;9(12):1198. doi: 10.3390/jof9121198. J Fungi (Basel). 2023. PMID: 38132798 Free PMC article.
-
Nuclear mRNA Export and Aging.Int J Mol Sci. 2022 May 13;23(10):5451. doi: 10.3390/ijms23105451. Int J Mol Sci. 2022. PMID: 35628261 Free PMC article. Review.
-
Nuclear mRNA maturation and mRNA export control: from trypanosomes to opisthokonts.Parasitology. 2021 Sep;148(10):1196-1218. doi: 10.1017/S0031182021000068. Epub 2021 Jan 19. Parasitology. 2021. PMID: 33461637 Free PMC article. Review.
-
Feedback to the central dogma: cytoplasmic mRNA decay and transcription are interdependent processes.Crit Rev Biochem Mol Biol. 2019 Aug;54(4):385-398. doi: 10.1080/10409238.2019.1679083. Epub 2019 Oct 27. Crit Rev Biochem Mol Biol. 2019. PMID: 31656086 Free PMC article. Review.
-
Sus1 maintains a normal lifespan through regulation of TREX-2 complex-mediated mRNA export.Aging (Albany NY). 2022 Jun 29;14(12):4990-5012. doi: 10.18632/aging.204146. Epub 2022 Jun 29. Aging (Albany NY). 2022. PMID: 35771153 Free PMC article.
References
Publication types
MeSH terms
Substances
Grants and funding
- ACOMP2014/061/Generalitat Valenciana/International
- PROMETEO2012/061/Generalitat Valenciana/International
- PROMETEOII 2015/006/Generalitat Valenciana/International
- GM059055/NH/NIH HHS/United States
- R01 GM059055/GM/NIGMS NIH HHS/United States
- BIO2012-40244/Ministerio de Economía y Competitividad/International
- BFU2011-23418/Ministerio de Economía y Competitividad/International
- BFU2014-57636/Ministerio de Economía y Competitividad/International
- AP2009-0917/Ministerio de Educación, Cultura y Deporte/International
- BFU2016-77728-C3-3-P/Ministerio de Economía y Competitividad/International
- 306000/FP7 Ideas: European Research Council/International
LinkOut - more resources
Full Text Sources
Other Literature Sources
Molecular Biology Databases
Research Materials
