Review
. 2019 Feb:86:140-149.
doi: 10.1016/j.semcdb.2018.03.019. Epub 2018 Mar 31.

Protein-nucleic acid interactions of LINE-1 ORF1p

Affiliations
Review

Protein-nucleic acid interactions of LINE-1 ORF1p

M Nabuan Naufer et al. Semin Cell Dev Biol. 2019 Feb.

Abstract

Long interspersed nuclear element 1 (LINE-1 or L1) is the dominant retrotransposon in mammalian genomes. L1 encodes two proteins ORF1p and ORF2p that are required for retrotransposition. ORF2p functions as the replicase. ORF1p is a coiled coil-mediated trimeric, high affinity RNA binding protein that packages its full- length coding transcript into an ORF2p-containing ribonucleoprotein (RNP) complex, the retrotransposition intermediate. ORF1p also is a nucleic acid chaperone that presumably facilitates the proposed nucleic acid remodeling steps involved in retrotransposition. Although detailed mechanistic understanding of ORF1p function in this process is lacking, recent studies showed that the rate at which ORF1p can form stable nucleic acid-bound oligomers in vitro is positively correlated with formation of an active L1 RNP as assayed in vivo using a cell culture-based retrotransposition assay. This rate was sensitive to minor amino acid changes in the coiled coil domain, which had no effect on nucleic acid chaperone activity. Additional studies linking the complex nucleic acid binding properties to the conformational changes of the protein are needed to understand how ORF1p facilitates retrotransposition.


Figures

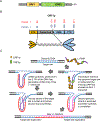
Fig. 1.
Fig. 1.
A) L1 domain structure. The domain organization of a typical full-length human L1 element. Approximate positions (not to scale) of the 5′ untranslated region (5′ UTR), ORF1, ORF2 (which includes endonuclease (EN) and reverse transcriptase (RT)), 3′ UTR, and the poly A tail are noted. B) Domain structure and trimeric depiction of ORF1p. The amino acid positions of the N-terminal domain (NTD), coiled coil domain (CC); RNA recognition motif (RRM) and C-terminal domain (CTD) for mouse [13,40,47,55] and human [36,44,46] ORF1p are denoted in red and blue text, respectively. C) Schematic of the proposed steps in TPRT [3,31,32]. Target site of the genomic DNA is depicted in blue shades and L1 RNA in purple. The first DNA strand at the target site is cleaved by ORF2p EN. The L1 RNA is annealed to the cleaved site and reverse transcribed by ORF2p RT to synthesize the first L1 cDNA (red). The second genomic target site strand is cleaved, and it primes the L1 cDNA to synthesize the second L1 DNA strand (magenta). Subsequent DNA synthesis required for completion is denoted in dashed lines. Consequently, target site duplications (TSD) are produced at the flanks of the newly synthesized L1 element. ORF1p may mediate strand exchange reactions required to anneal the primers and/or facilitate nucleic acid arrangements during reverse transcription.
Fig. 2.
Fig. 2.. Alignment of mouse and human ORF1p sequences.
Consensus sequences of the mouse L1Tf family [13] and the human Ta1 subfamily of the currently active L1Pa1 [15] family were aligned. The middle L1T1f/Ta1 sequences shows the comparison between the aligned elements. A dot indicates identity, dashes indicate gaps, and lower case indicates conservative amino acid differences. The bottom entry (Identical) shows the 100% identical positions. The numbers in black refer to the L1Tf, and those in red, the L1Ta1 sequence. The beginning and end of the coiled coil domain, and the starts of the RNA recognition motif (RRM) and C-terminal domain (CTD) are indicated. The coordinates of the RRM and CTD were taken from references [36,47]. The alignment is also annotated with the following information: The beginning of truncated M128 [44], which is largely a monomer at ≥20 °C; the location of a natural variant in the mouse coiled coil domain (D159H, using the L1Tf numbering with an offset of plus 4 in the mouse alignment only to account for the 4 position gap introduced into the alignment of L1Tf between positions 40 and 45) [41,26,38,46] paired mutations in two adjacent highly conserved arginine residues of the CTD, in human ([26,29]) and in mouse [42]. Heptad repeats are highlighted in green and yellow. RNP1 and RNP2 sequences are highlighted in light brown [36]. Regarding the “phenotype” of these mutations: retro means retrotransposition as measured in a cell culture based retrotransposition assay [26]; RNP means the presence of ORF1p in RNP particles isolated from in vivo assays; RNA binding means as performed with purified ORF1p protein in vitro; chaperone means chaperone activity (as described in [42]).
Fig. 3.
Fig. 3.. ORF1p polymerization.
Schematic representation of possible ORF1p species and their cross-linked products as observed in Callahan et al. [44]. The numbers to the left of the cartoons of the cross-linked species indicate their monomer content. 4..n and 5..n indicate higher orders of multimers beyond 3 or 4, respectively. Higher orders of ORF1p multimers of trimers were observed in crosslinking experiments with 1 mM EGS, in the presence of oligonucleotides at 0.05 M NaCl.
Fig. 4.
Fig. 4.. Single molecule DNA stretching.
A) Schematic depiction of an optical tweezers system. A single molecule of DNA (48.5 kbp) is attached by its biotinylated ends to streptavidin-coated polystyrene beads. One bead is immobilized by a glass micropipette attached to a flow cell while the other is held in an optical trap. The optical trap is created by converging two counter-propagating laser beams to overlap in space using microscope objectives. By moving the glass micropipette attached to the flow cell, the tethered DNA molecule is stretched, and the force exerted on the DNA is measured as a function of extension in the presence and absence of protein. B) Solid and empty black circles (also the solid and dashed black lines in Figs. 5A and 6 A) represent the stretch and return curves of a bare dsDNA molecule. The green circles represent the force-extension curve of an ssDNA molecule. The distinct regimes of the dsDNA force-extension profile are denoted in grey text. At forces ≪~60 pN the DNA molecule is primarily double-stranded. The plateau at ~60 pN represents a sharp overstretching transition, where very little additional force causes the DNA molecule to stretch to almost twice its contour length. This is due to force-induced melting of the DNA molecule and this transition is referred to as the helix-coil transition [73]. The force range over which this transition occurs is defined as the helix-coil transition width (or transition width). In the salt conditions used in these studies, the stretched dsDNA molecule is mostly single-stranded at forces higher than the helix-coil transition. The stretch and return cycles of the bare DNA molecule are almost reversible and immediate re-annealing of the duplex is observed when the stretched DNA molecule is returned to zero-force (empty black circles).
Fig. 5.
Fig. 5.. Single molecule DNA stretching results from mouse ORF1p mutational analyses [41,42,59].
Solid and dashed blue lines are the stretch and return curves of dsDNA in the presence of 15 nM wild type mouse ORF1p. ΔF is the relative increase in the helix-coil transition width due to bound protein, where ΔF = δF–δF0. Here, δF0 (~4pN) and δF are the helix-coil transition widths in the absence and presence of protein, respectively. δF (shown as the force difference between the solid red lines) is determined by the intersection of the dashed red lines on the figure, which represent ds- and ss- DNA regimes of the ORF1p-DNA complex. Thus, ΔF is a measure of the relative increase in force (due to bound protein) required in the cooperative conversion of ds- to ss- DNA, which was shown to be positively correlated with the nucleic acid chaperone capabilities of the bound protein as described in the text. B) ΔF at 15 or 20 nM protein concentration, as measured in single molecule DNA stretching assays (blue), and retrotransposition activity in cultured in vivo assays (red) for ORF1p mutants, presented after normalizing with the corresponding values for the wild type protein. The transition width for the RR297:298AA mutant at these concentrations was not reported due to its lower binding affinity. However, it was shown to saturate at a 5-fold higher concentration than what was used for wild type protein. The empty bar is to denote that the transition width is likely much smaller at these concentrations in comparison with the wild type protein. Extensive aggregation of single- or double- stranded DNA in comparison with the wildtype protein, are denoted with a plus sign. While aggregation is important to facilitate DNA interactions and can increase chaperone activity, extensive aggregate formation can also slow down DNA interaction kinetics, which may in turn inhibit chaperone activity [79]. The ability to bind RNA as observed in the bulk solution assays is also reported. The plus sign denotes comparable binding affinity as wild type and these mutants are ranked according to their relative binding affinities, with (−) the lowest and (3+) the highest affinity. ‘nd’ represents ‘not determined’.
Fig. 6.
Fig. 6.. Single molecule studies of human ORF1p [43].
A) In contrast to the studies described in Fig. 5, here, the DNA molecule is overstretched above the helix-coil transition up to the ssDNA regime before incubating it with the protein, in order to minimize dsDNA binding effects and exclusively investigate ssDNA-ORF1p binding kinetics. Solid and dashed line represent the stretch-return cycle of a bare dsDNA, with the return curve also referred to as 0 min incubation. The colored empty circles are the return curves of a DNA molecule after incubating with 2 nM protein at ~70 pN for different time periods. The gold curve listed as saturated represents the maximum shift in extension towards ssDNA, obtained at long incubation times and greater than 15 nM protein concentration. The ssDNA-bound protein during the incubation prevents reannealing and thereby shift the relaxation curve after protein incubation towards the ssDNA curve (see green circles, Fig. 4B), allowing one to quantitatively probe the ssDNA fraction bound as a function of time. The solid lines represent the fitted curves as described elsewhere [43]. ORF1p rapidly binds ssDNA. However, it transforms relatively slowly into stable oligomers. Less stable proteins (presumably un-transformed trimers) dissociate during the return cycle and the ssDNA fraction bound by such proteins is defined as the fast fraction in this study. The fast fraction decreases with incubation time as they transform into more stable oligomers on ssDNA. B) Fast fraction as a function of time for modern human (111p, from L1Pa1 family), its resuscitated ancestral primate (555p, from L1Pa5 family) and a mosaic ORF1p (151p) in which 9 residues in the coiled coil are replaced with the corresponding ancestral residues, as shown in the inset (also see Fig. 2 where these residues are indicated in teal). Domain boundaries in the inset correspond to Fig. 1B and white and grey shades represent the amino acid residues of the modern and ancestral ORF1p, respectively. The number of amino acid substitutions relative to the modern ORF1p is denoted in the relevant domains in the other two ORF1p variants. The measured fast fraction is modeled as a sum of increasing and decreasing exponential functions (solid lines) and red, blue and green represent modern, ancestral, and mosaic proteins, respectively. The fast fraction rapidly saturates for all three variants, indicating rapid protein binding to ssDNA. However, this fraction decreases with increasing incubation time as the proteins form more stable oligomers. Therefore, the rate at which the fast fraction decreases is proportional to the rate of stable oligomerization of protein on ssDNA. The retrotransposition-incompetent mosaic ORF1p was at least 10-fold slower in forming stable oligomers in comparison with the active human and primate protein variants.
Fig. 7.
Fig. 7.. Retrotransposition assay.
A) Organization of an L1 vector in a typical retrotransposition assay. The L1 vector contains an antisense copy of the neo gene disrupted by an intron in the sense orientation. sd and sa are the splice donor and splice acceptor sites, respectively. The intron of the transcribed L1 vector will be spliced and contain the antisense copy of the neo gene. Retrotransposition competent elements will support subsequent cDNA synthesis of this transcript at a DNA target site and ultimately the insertion of an active copy of the neo gene, which when expressed from its promoter (Pr, in red) generates colonies of G418 resistant cells or foci. B) An example of stained foci generated from the retrotransposition assay described in (A) [43]. p111_rtc, p151_rtc and p555_rtc are the L1 vectors containing the modern human, mosaic and the resuscitated primate ORF1 sequences (see inset of Fig. 6B), respectively.

Similar articles

Cited by

References

    1. Furano AV, The biological properties and evolutionary dynamics of mammalian LINE-1 retrotransposons, Prog. Nucleic Acid Res. Mol. Biol 64 (2000) 255–294. - PubMed
    1. Lander ES, Linton LM, Birren B, Nusbaum C, Zody MC, et al., Initial sequencing and analysis of the human genome, Nature 409 (6822) (2001) 860–921. - PubMed
    1. Kazazian HH Jr., Moran JV, Mobile DNA in health and disease, N. Engl. J. Med 377 (4) (2017) 361–370. - PMC - PubMed
    1. Esnault C, Maestre J, Heidmann T, Human LINE retrotransposons generate processed pseudogenes, Nat. Genet 24 (4) (2000) 363–367. - PubMed
    1. Wei W, Gilbert N, Ooi SL, Lawler JF, Ostertag EM, Kazazian HH, Boeke JD, Moran JV, Human L1 retrotransposition: cis preference versus trans complementation, Mol. Cell. Biol 21 (4) (2001) 1429–1439. - PMC - PubMed

Publication types