The Influence of Obesity on the Pharmacokinetics of Dioxin in Mice: An Assessment Using Classical and PBPK Modeling
- PMID: 29596651
- PMCID: PMC6016688
- DOI: 10.1093/toxsci/kfy078
The Influence of Obesity on the Pharmacokinetics of Dioxin in Mice: An Assessment Using Classical and PBPK Modeling
Abstract
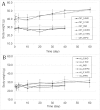
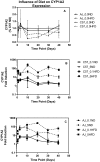
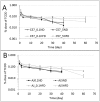
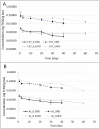
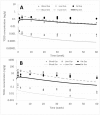
The effects of body fat mass on the elimination of 2,3,7,8-tetrachlorodibenzo-p-dioxin (TCDD) was examined in mice. When male C57BL/6J mice are fed a high-fat, simple carbohydrate diet (HFD) for 13 weeks, they develop an obese phenotype. In contrast, A/J mice fed an HFD do not become obese. After 13 weeks on a normal diet (ND) or HFD, male C57BL/6J and A/J mice received a single dose by gavage of 0.1 or 5.0 µg of 2,3,7,8-tetrachloro[1,6-3H] dibenzo-p-dioxin per kg body weight. Using classical pharmacokinetics, the blood elimination half-life of TCDD was approximately 10 and 2 times longer in the C57BL/6J on the HFD compared with the mice on the ND at 0.1 and 5.0 μg/kg doses, respectively. The diet did not increase the blood half-life of TCDD in the A/J mice, which did not get obese. Using a physiologically based pharmacokinetic model for TCDD that incorporated experimentally derived percent body fat mass and tissue partition coefficients, as well as data on hepatic sequestration, did not provide accurate predictions to the data and could not explain the increase in half-life of TCDD in the HFD groups. This work demonstrates that obesity influences the half-life of TCDD, but other undetermined factors are involved in its elimination because the increase in body fat mass, decreases in cytochrome P4501A2, and altered partition coefficients could not completely explain the prolonged half-life.
Figures



Similar articles
-
Use of a physiologically based pharmacokinetic model for rats to study the influence of body fat mass and induction of CYP1A2 on the pharmacokinetics of TCDD.Environ Health Perspect. 2006 Sep;114(9):1394-400. doi: 10.1289/ehp.8805. Environ Health Perspect. 2006. PMID: 16966094 Free PMC article.
-
Chronic exposure of 2,3,7,8-tetrachlorodibenzo-p-dioxin (TCDD) induces an obesogenic effect in C57BL/6J mice fed a high fat diet.Toxicology. 2017 Sep 1;390:43-52. doi: 10.1016/j.tox.2017.07.017. Epub 2017 Aug 1. Toxicology. 2017. PMID: 28774668
-
Sensitivity analysis of a physiological model for 2,3,7,8-tetrachlorodibenzo-p-dioxin (TCDD): assessing the impact of specific model parameters on sequestration in liver and fat in the rat.Toxicol Sci. 2000 Mar;54(1):71-80. doi: 10.1093/toxsci/54.1.71. Toxicol Sci. 2000. PMID: 10746933
-
The effect of dose on 2,3,7,8-TCDD tissue distribution, metabolism and elimination in CYP1A2 (-/-) knockout and C57BL/6N parental strains of mice.Toxicol Appl Pharmacol. 2009 Nov 15;241(1):119-26. doi: 10.1016/j.taap.2009.08.009. Epub 2009 Aug 18. Toxicol Appl Pharmacol. 2009. PMID: 19695277
-
Biologically-based models of dioxin pharmacokinetics.Toxicology. 1995 Sep 1;102(1-2):125-31. doi: 10.1016/0300-483x(95)03041-d. Toxicology. 1995. PMID: 7482547 Review.
Cited by
-
PCB126 induced toxic actions on liver energy metabolism is mediated by AhR in rats.Toxicology. 2022 Jan 30;466:153054. doi: 10.1016/j.tox.2021.153054. Epub 2021 Nov 27. Toxicology. 2022. PMID: 34848246 Free PMC article.
-
Impact of obese levels on the hepatic expression of nuclear receptors and drug-metabolizing enzymes in adult and offspring mice.Acta Pharm Sin B. 2020 Jan;10(1):171-185. doi: 10.1016/j.apsb.2019.10.009. Epub 2019 Nov 28. Acta Pharm Sin B. 2020. PMID: 31993314 Free PMC article.
-
A Physiologically Based Pharmacokinetic (PBPK) Modeling Framework for Mixtures of Dioxin-like Compounds.Toxics. 2022 Nov 17;10(11):700. doi: 10.3390/toxics10110700. Toxics. 2022. PMID: 36422908 Free PMC article.
References
-
- Abernethy D. R., Greenblatt D. J., Divoll M., Smith R. B., Shader R. I. (1984). The influence of obesity on the pharmacokinetics of oral alprazolam and triazolam. Clin. Pharmacokinet. 9, 177–183. - PubMed
-
- Abraham K., Wiesmüller T., Brunner H., Krowke R., Hagenmaier H., Neubert D. (1989). Elimination of various polychlorinated dibenzo-p-dioxins and dibenzofurans (PCDDs and PCDFs) in rat faeces. Arch. Toxicol. 63, 75–78. - PubMed
-
- Andersen M. E. (2003). Toxicokinetic modeling and its applications in chemical risk assessment. Toxicol. Lett. 138, 9–27. - PubMed
-
- Bardova K., Horakova O., Janovska P., Hansikova J., Kus V., van Schothorst E. M., Hoevenaars F. P. M., Uil M., Hensler M., Keijer J. et al. , . (2016). Early differences in metabolic flexibility between obesity-resistant and obesity-prone mice. Biochimie 124, 163–170. - PubMed
Publication types
MeSH terms
Substances
LinkOut - more resources
Full Text Sources
Other Literature Sources
Medical

