Crotamine induces browning of adipose tissue and increases energy expenditure in mice
- PMID: 29567992
- PMCID: PMC5864908
- DOI: 10.1038/s41598-018-22988-1
Crotamine induces browning of adipose tissue and increases energy expenditure in mice
Abstract
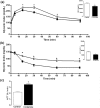
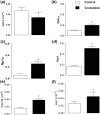
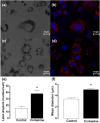
Crotamine, originally isolated from rattlesnake venom, has been extensively studied due to its pleiotropic biological properties, and special attention has been paid to its antitumor activity. However, long-term treatment with crotamine was accompanied by a reduction in animal body weight gain and by increases in glucose tolerance. As cancer is commonly associated with cachexia, to preclude the possible cancer cachexia-like effect of crotamine, herein this polypeptide was administered in healthy wild-type C57/BL6 mice by the oral route daily, for 21 days. Reduced body weight gain, in addition to decreased white adipose tissue (WAT) and increased brown adipose tissue (BAT) mass were observed in healthy animals in the absence of tumor. In addition, we observed improved glucose tolerance and increased insulin sensitivity, accompanied by a reduction of plasma lipid levels and decreased levels of biomarkers of liver damage and kidney disfunctions. Importantly, long-term treatment with crotamine increased the basal metabolic rate in vivo, which was consistent with the increased expression of thermogenic markers in BAT and WAT. Interestingly, cultured brown adipocyte cells induced to differentiation in the presence of crotamine also showed increases in some of these markers and in lipid droplets number and size, indicating increased brown adipocyte maturation.
Conflict of interest statement
The authors declare no competing interests.
Figures


Similar articles
-
Erythropoietin (EPO) ameliorates obesity and glucose homeostasis by promoting thermogenesis and endocrine function of classical brown adipose tissue (BAT) in diet-induced obese mice.PLoS One. 2017 Mar 13;12(3):e0173661. doi: 10.1371/journal.pone.0173661. eCollection 2017. PLoS One. 2017. PMID: 28288167 Free PMC article.
-
Adipocyte-specific Hypoxia-inducible gene 2 promotes fat deposition and diet-induced insulin resistance.Mol Metab. 2016 Sep 28;5(12):1149-1161. doi: 10.1016/j.molmet.2016.09.009. eCollection 2016 Dec. Mol Metab. 2016. PMID: 27900258 Free PMC article.
-
Secretory phospholipase A2 group IIA enhances the metabolic rate and increases glucose utilization in response to thyroid hormone.FASEB J. 2019 Jan;33(1):738-749. doi: 10.1096/fj.201800711R. Epub 2018 Jul 18. FASEB J. 2019. PMID: 30020829
-
Browning of white fat: agents and implications for beige adipose tissue to type 2 diabetes.J Physiol Biochem. 2019 Feb;75(1):1-10. doi: 10.1007/s13105-018-0658-5. Epub 2018 Nov 30. J Physiol Biochem. 2019. PMID: 30506389 Free PMC article. Review.
-
CIDE Family-Mediated Unique Lipid Droplet Morphology in White Adipose Tissue and Brown Adipose Tissue Determines the Adipocyte Energy Metabolism.J Atheroscler Thromb. 2017 Oct 1;24(10):989-998. doi: 10.5551/jat.RV17011. Epub 2017 Sep 5. J Atheroscler Thromb. 2017. PMID: 28883211 Free PMC article. Review.
Cited by
-
Synthetic polypeptide crotamine: characterization as a myotoxin and as a target of combinatorial peptides.J Mol Med (Berl). 2022 Jan;100(1):65-76. doi: 10.1007/s00109-021-02140-9. Epub 2021 Oct 13. J Mol Med (Berl). 2022. PMID: 34643765
-
Enoxacin induces oxidative metabolism and mitigates obesity by regulating adipose tissue miRNA expression.Sci Adv. 2020 Dec 2;6(49):eabc6250. doi: 10.1126/sciadv.abc6250. Print 2020 Dec. Sci Adv. 2020. PMID: 33268375 Free PMC article.
-
Cissus Quadrangularis enhances UCP1 mRNA, indicative of white adipocyte browning and decreases central obesity in humans in a randomized trial.Sci Rep. 2021 Jan 21;11(1):2008. doi: 10.1038/s41598-021-81606-9. Sci Rep. 2021. PMID: 33479386 Free PMC article. Clinical Trial.
-
Fat Wasting Is Damaging: Role of Adipose Tissue in Cancer-Associated Cachexia.Front Cell Dev Biol. 2020 Feb 12;8:33. doi: 10.3389/fcell.2020.00033. eCollection 2020. Front Cell Dev Biol. 2020. PMID: 32117967 Free PMC article. Review.
-
Bioprospection of rattlesnake venom peptide fractions with anti-adipose and anti-insulin resistance activity in vitro.Toxicon X. 2024 Sep 19;24:100209. doi: 10.1016/j.toxcx.2024.100209. eCollection 2024 Dec. Toxicon X. 2024. PMID: 39398348 Free PMC article.
References
Publication types
MeSH terms
Substances
LinkOut - more resources
Full Text Sources
Other Literature Sources
Medical
Research Materials

