

Out Like a Light? The Effects of a Diurnal Husbandry Schedule on Mouse Sleep and Behavior
- PMID: 29555001
- PMCID: PMC5868378
Out Like a Light? The Effects of a Diurnal Husbandry Schedule on Mouse Sleep and Behavior
Abstract
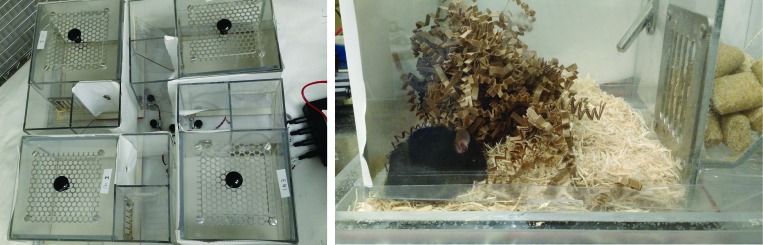
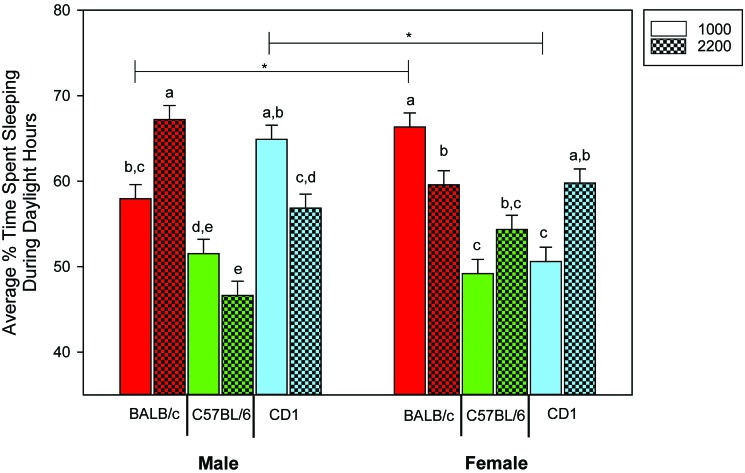
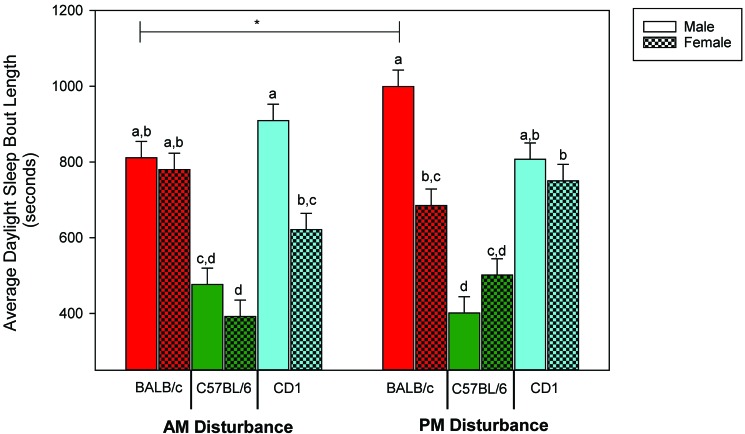
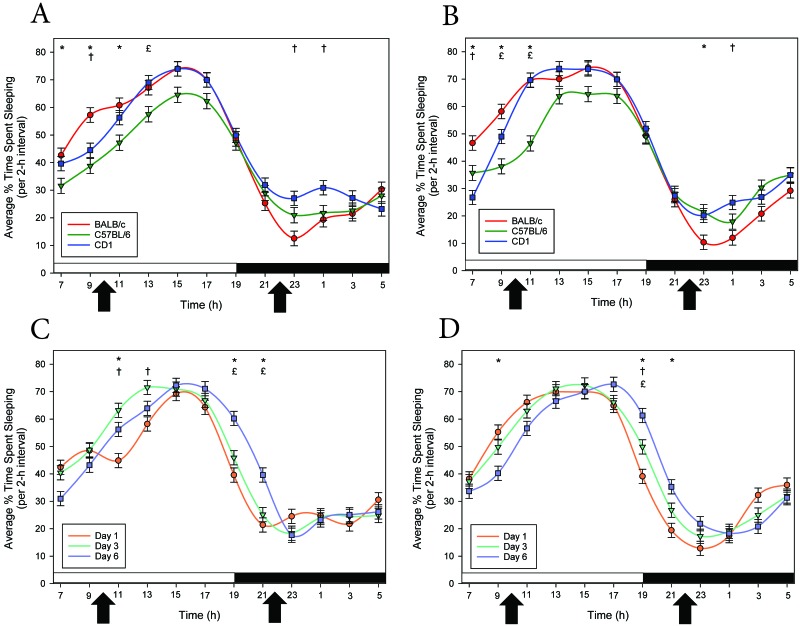
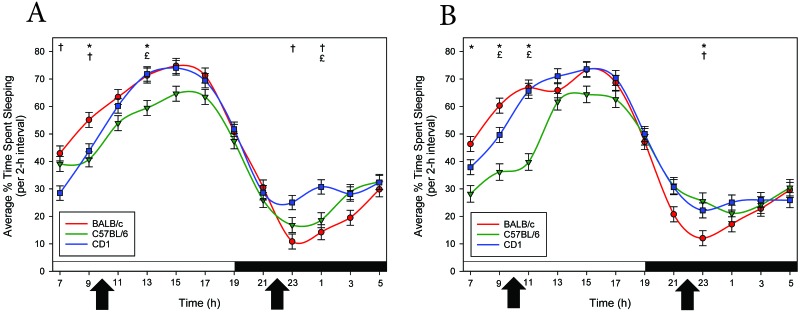
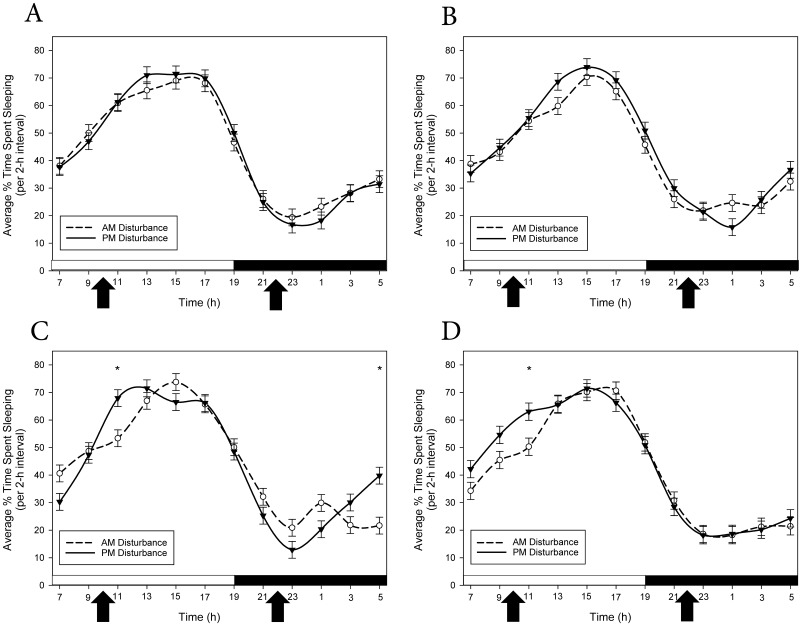
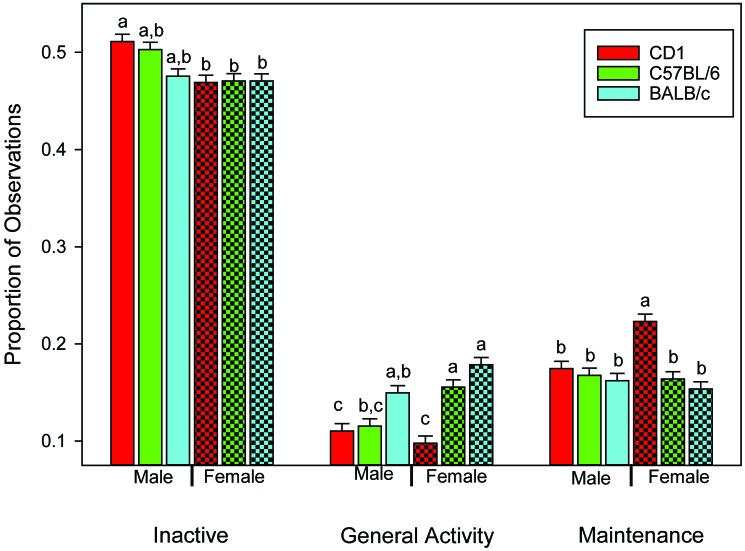
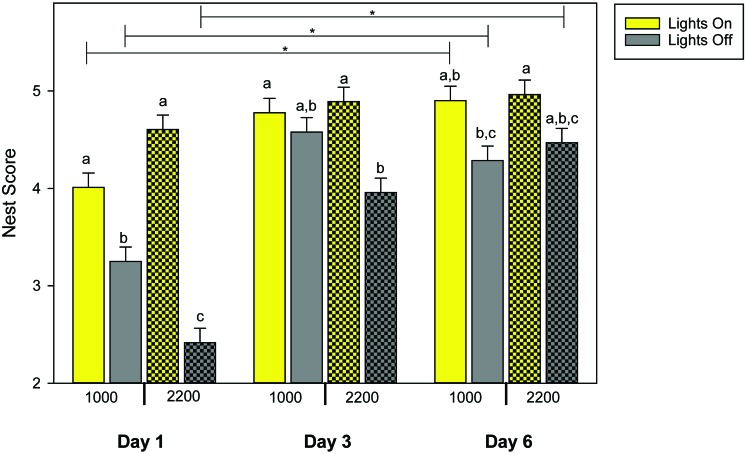
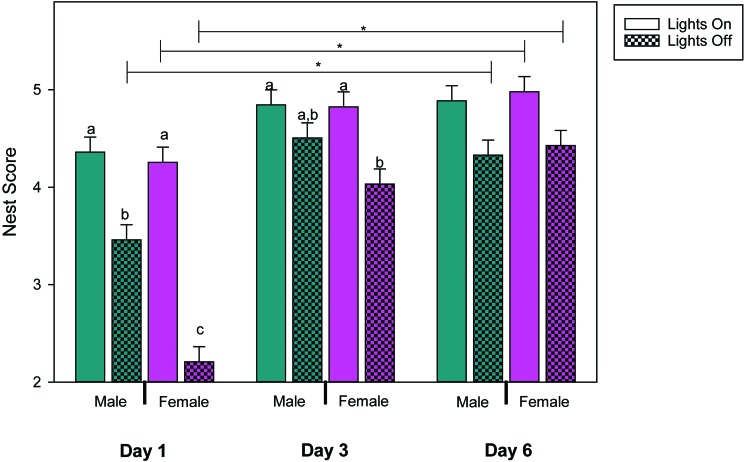
Sleep disruption in humans, caused by shift work, can be detrimental to physical and behavioral health. Nocturnal laboratory mice may experience a similar disruption caused by human daytime activities, but whether this disruption affects their welfare is unknown. We used 48 mice (CD1, C57BL/6, and BALB/c of both sexes) in a factorial design to test a sleep disruption treatment, in which mice were disturbed by providing routine husbandry at either 1000 or 2200 during a 12:12-h light:dark cycle, with lights on at 0700. All mice were exposed for 1 wk to each disruption treatment, and we used a noninvasive sleep monitoring apparatus to monitor and record sleep. To determine whether providing nesting material ameliorated effects of sleep disruption, we tested 4 amounts of nesting material (3, 6, 9, or 12 g) and continuously recorded sleep in the home cage for 2 wk. C57BL/6 mice, regardless of sex or disruption timing, slept the least overall. There was a strong interaction of sex and type of mouse on sleep across 24 h. Mice slept less during the first day of the daytime disturbance than on day 6. These results suggest that disturbance timing affects sleep patterns in mice but not their overall amount of sleep and that the changes in sleep patterns vary between mouse type and sex. In addition, mice appear to both anticipate and acclimate to human activity during the day. Our welfare checks were possibly too predictable and inconsequential to induce true sleep disruption.
Figures

Similar articles
-
Sleeping through anything: The effects of unpredictable disruptions on mouse sleep, healing, and affect.PLoS One. 2019 Jan 31;14(1):e0210620. doi: 10.1371/journal.pone.0210620. eCollection 2019. PLoS One. 2019. PMID: 30703113 Free PMC article.
-
Circadian Disruption: comparing humans with mice.Chronobiol Int. 2013 Oct;30(8):1066-71. doi: 10.3109/07420528.2013.797428. Epub 2013 Jul 18. Chronobiol Int. 2013. PMID: 23866054
-
Combinations of bright light, scheduled dark, sunglasses, and melatonin to facilitate circadian entrainment to night shift work.J Biol Rhythms. 2003 Dec;18(6):513-23. doi: 10.1177/0748730403258422. J Biol Rhythms. 2003. PMID: 14667152 Clinical Trial.
-
Hormonal and pharmacological manipulation of the circadian clock: recent developments and future strategies.Sleep. 2000 May 1;23 Suppl 3:S77-85. Sleep. 2000. PMID: 10809190 Review.
-
Non-circadian direct effects of light on sleep and alertness: lessons from transgenic mouse models.Sleep Med Rev. 2013 Dec;17(6):445-52. doi: 10.1016/j.smrv.2012.12.004. Epub 2013 Apr 17. Sleep Med Rev. 2013. PMID: 23602126 Review.
Cited by
-
A circadian behavioral analysis suite for real-time classification of daily rhythms in complex behaviors.bioRxiv [Preprint]. 2024 Aug 7:2024.02.23.581778. doi: 10.1101/2024.02.23.581778. bioRxiv. 2024. PMID: 39149294 Free PMC article. Preprint.
-
Role of Environment and Experimenter in Reproducibility of Behavioral Studies With Laboratory Mice.Front Behav Neurosci. 2022 Feb 18;16:835444. doi: 10.3389/fnbeh.2022.835444. eCollection 2022. Front Behav Neurosci. 2022. PMID: 35250504 Free PMC article.
-
Post-inflammatory behavioural despair in male mice is associated with reduced cortical glutamate-glutamine ratios, and circulating lipid and energy metabolites.Sci Rep. 2020 Oct 8;10(1):16857. doi: 10.1038/s41598-020-74008-w. Sci Rep. 2020. PMID: 33033375 Free PMC article.
-
Bouts of rest and physical activity in C57BL/6J mice.PLoS One. 2023 Jun 26;18(6):e0280416. doi: 10.1371/journal.pone.0280416. eCollection 2023. PLoS One. 2023. PMID: 37363906 Free PMC article.
-
Retrospective Analysis of the Effects of Identification Procedures and Cage Changing by Using Data from Automated, Continuous Monitoring.J Am Assoc Lab Anim Sci. 2019 Mar 1;58(2):126-141. doi: 10.30802/AALAS-JAALAS-18-000056. Epub 2019 Feb 14. J Am Assoc Lab Anim Sci. 2019. PMID: 30764898 Free PMC article.
References
-
- Albert N, da Silva C, Diez-Noguera A, Cambras T. 2013. Different adaptation of the motor activity rhythm to chronic phase shifts between adolescent and adult rats. Behav Brain Res 252:347–355. - PubMed
-
- Archer SN, Oster H. 2015. How sleep and wakefulness influence circadian rhythmicity: effects of insufficient and mistimed sleep on the animal and human transcriptome. J Sleep Res 24:476–493. - PubMed
-
- Balcombe JP. 2006. Laboratory environments and rodents’ behavioural needs: a review. Lab Anim 40:217–235. - PubMed
-
- Baumans V. 2000. Environmental enrichment: a right of rodents! p 1251–1255. In: Balls M, VanZeller AM, Halder ME. Progress in the reduction, refinement, and replacement of animal experimentation, vol 31 Amsterdam (Netherlands): Elsevier
-
- Belzung C, Griebel G. 2001. Measuring normal and pathological anxiety-like behaviour in mice: a review. Behav Brain Res 125:141–149. - PubMed
Publication types
MeSH terms
LinkOut - more resources
Full Text Sources