Species classifier choice is a key consideration when analysing low-complexity food microbiome data
- PMID: 29554948
- PMCID: PMC5859664
- DOI: 10.1186/s40168-018-0437-0
Species classifier choice is a key consideration when analysing low-complexity food microbiome data
Abstract
Background: The use of shotgun metagenomics to analyse low-complexity microbial communities in foods has the potential to be of considerable fundamental and applied value. However, there is currently no consensus with respect to choice of species classification tool, platform, or sequencing depth. Here, we benchmarked the performances of three high-throughput short-read sequencing platforms, the Illumina MiSeq, NextSeq 500, and Ion Proton, for shotgun metagenomics of food microbiota. Briefly, we sequenced six kefir DNA samples and a mock community DNA sample, the latter constructed by evenly mixing genomic DNA from 13 food-related bacterial species. A variety of bioinformatic tools were used to analyse the data generated, and the effects of sequencing depth on these analyses were tested by randomly subsampling reads.
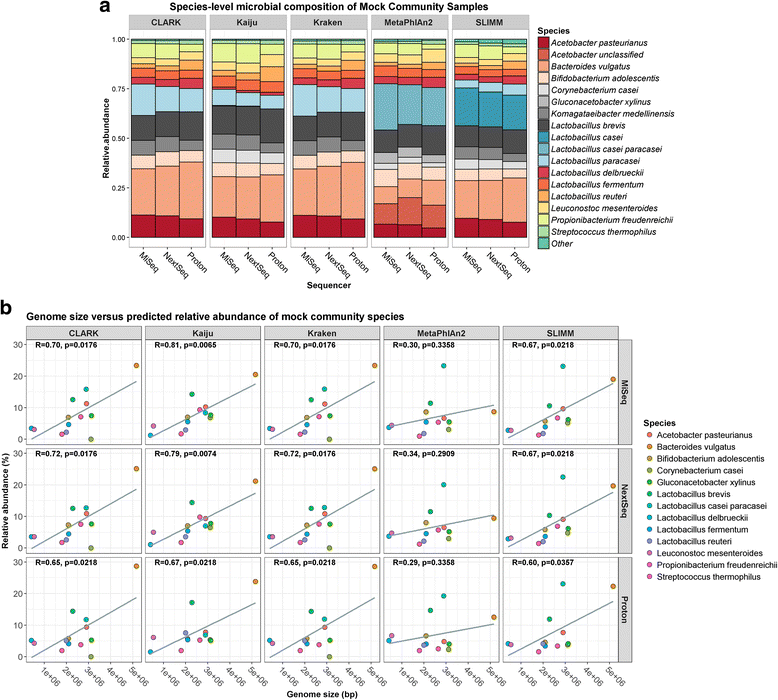
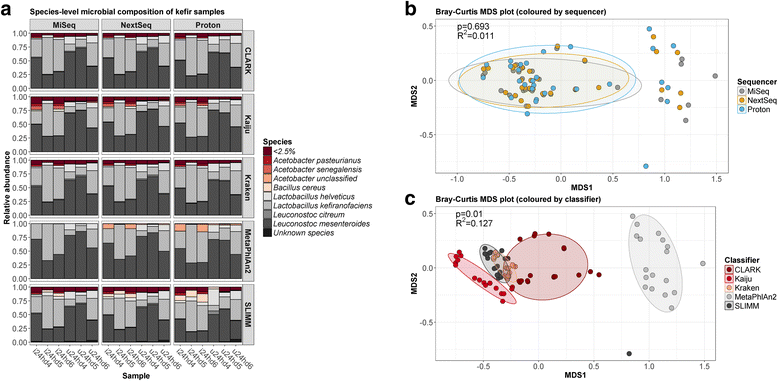
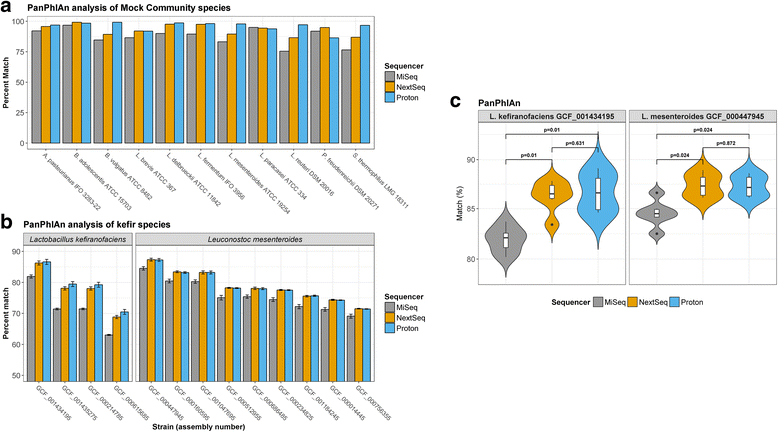
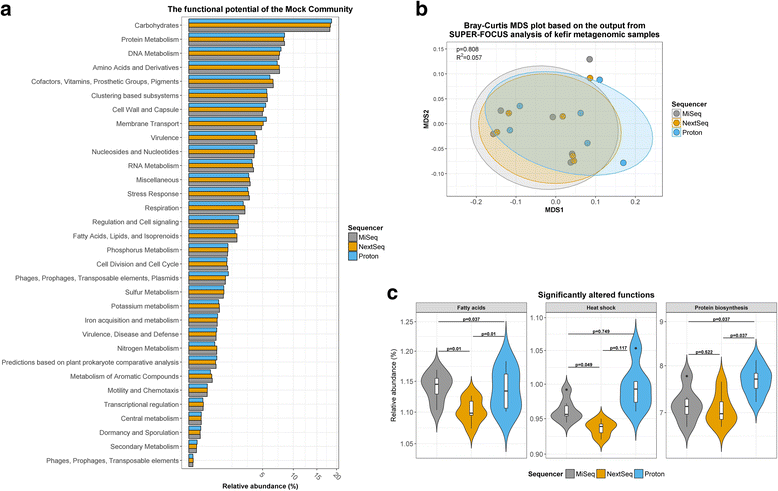
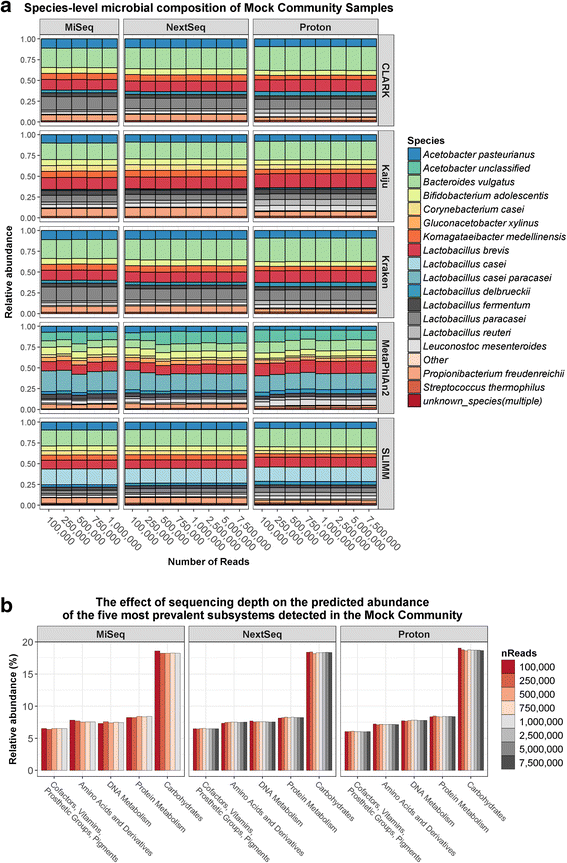
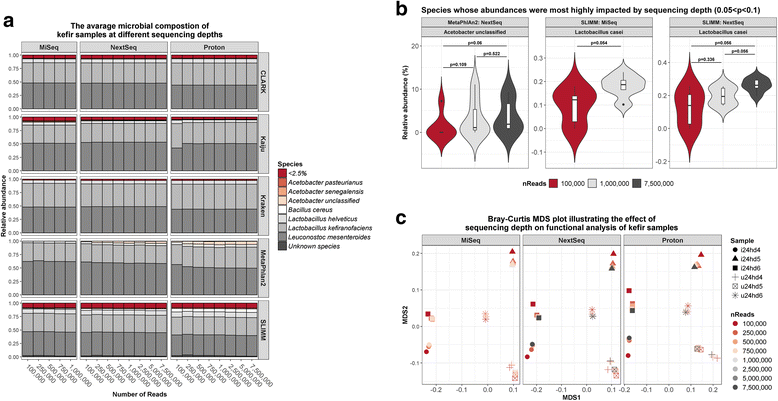
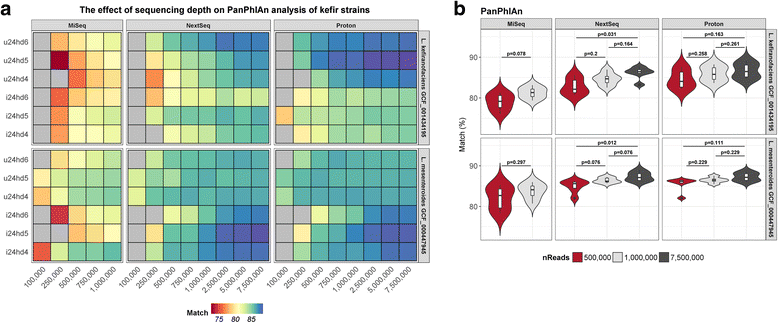
Results: Compositional analysis results were consistent between the platforms at divergent sequencing depths. However, we observed pronounced differences in the predictions from species classification tools. Indeed, PERMANOVA indicated that there was no significant differences between the compositional results generated by the different sequencers (p = 0.693, R2 = 0.011), but there was a significant difference between the results predicted by the species classifiers (p = 0.01, R2 = 0.127). The relative abundances predicted by the classifiers, apart from MetaPhlAn2, were apparently biased by reference genome sizes. Additionally, we observed varying false-positive rates among the classifiers. MetaPhlAn2 had the lowest false-positive rate, whereas SLIMM had the greatest false-positive rate. Strain-level analysis results were also similar across platforms. Each platform correctly identified the strains present in the mock community, but accuracy was improved slightly with greater sequencing depth. Notably, PanPhlAn detected the dominant strains in each kefir sample above 500,000 reads per sample. Again, the outputs from functional profiling analysis using SUPER-FOCUS were generally accordant between the platforms at different sequencing depths. Finally, and expectedly, metagenome assembly completeness was significantly lower on the MiSeq than either on the NextSeq (p = 0.03) or the Proton (p = 0.011), and it improved with increased sequencing depth.
Conclusions: Our results demonstrate a remarkable similarity in the results generated by the three sequencing platforms at different sequencing depths, and, in fact, the choice of bioinformatics methodology had a more evident impact on results than the choice of sequencer did.
Keywords: Low-complexity microbiome; Sequencing platform comparison; Shotgun metagenomics.
Conflict of interest statement
Ethics approval and consent to participate
Not applicable
Consent for publication
Not applicable
Competing interests
The authors declare that they have no competing interests.
Publisher’s Note
Springer Nature remains neutral with regard to jurisdictional claims in published maps and institutional affiliations.
Figures

Similar articles
-
MinION™ nanopore sequencing of environmental metagenomes: a synthetic approach.Gigascience. 2017 Mar 1;6(3):1-10. doi: 10.1093/gigascience/gix007. Gigascience. 2017. PMID: 28327976 Free PMC article.
-
Optimisation of methods for bacterial skin microbiome investigation: primer selection and comparison of the 454 versus MiSeq platform.BMC Microbiol. 2017 Jan 21;17(1):23. doi: 10.1186/s12866-017-0927-4. BMC Microbiol. 2017. PMID: 28109256 Free PMC article.
-
A comparison of sequencing platforms and bioinformatics pipelines for compositional analysis of the gut microbiome.BMC Microbiol. 2017 Sep 13;17(1):194. doi: 10.1186/s12866-017-1101-8. BMC Microbiol. 2017. PMID: 28903732 Free PMC article.
-
High throughput sequencing methods for microbiome profiling: application to food animal systems.Anim Health Res Rev. 2012 Jun;13(1):40-53. doi: 10.1017/S1466252312000126. Anim Health Res Rev. 2012. PMID: 22853944 Review.
-
High throughput sequencing methods and analysis for microbiome research.J Microbiol Methods. 2013 Dec;95(3):401-14. doi: 10.1016/j.mimet.2013.08.011. Epub 2013 Sep 9. J Microbiol Methods. 2013. PMID: 24029734 Review.
Cited by
-
Inflammation, Gut Microbiota, and Metabolomic Shifts in Colorectal Cancer: Insights from Human and Mouse Models.Int J Mol Sci. 2024 Oct 17;25(20):11189. doi: 10.3390/ijms252011189. Int J Mol Sci. 2024. PMID: 39456970 Free PMC article.
-
Metagenomic and Metabolomic Profiling Reveals the Differences of Flavor Quality between Hongqu Rice Wines Fermented with Gutian Qu and Wuyi Qu.Foods. 2024 Sep 29;13(19):3114. doi: 10.3390/foods13193114. Foods. 2024. PMID: 39410149 Free PMC article.
-
An in-depth evaluation of metagenomic classifiers for soil microbiomes.Environ Microbiome. 2024 Mar 28;19(1):19. doi: 10.1186/s40793-024-00561-w. Environ Microbiome. 2024. PMID: 38549112 Free PMC article.
-
Enhancing Clinical Utility: Utilization of International Standards and Guidelines for Metagenomic Sequencing in Infectious Disease Diagnosis.Int J Mol Sci. 2024 Mar 15;25(6):3333. doi: 10.3390/ijms25063333. Int J Mol Sci. 2024. PMID: 38542307 Free PMC article. Review.
-
Carbohydrate-active enzyme profiles of Lactiplantibacillus plantarum strain 84-3 contribute to flavor formation in fermented dairy and vegetable products.Food Chem X. 2023 Nov 25;20:101036. doi: 10.1016/j.fochx.2023.101036. eCollection 2023 Dec 30. Food Chem X. 2023. PMID: 38059176 Free PMC article.
References
Publication types
MeSH terms
Substances
Grants and funding
LinkOut - more resources
Full Text Sources
Other Literature Sources

