. 2018 Jul:47:1-15.
doi: 10.1016/j.cellsig.2018.03.003. Epub 2018 Mar 14.

Distinct signalling properties of insulin receptor substrate (IRS)-1 and IRS-2 in mediating insulin/IGF-1 action

Affiliations

Distinct signalling properties of insulin receptor substrate (IRS)-1 and IRS-2 in mediating insulin/IGF-1 action

Atefeh Rabiee et al. Cell Signal. 2018 Jul.

Abstract

Insulin/IGF-1 action is driven by a complex and highly integrated signalling network. Loss-of-function studies indicate that the major insulin/IGF-1 receptor substrate (IRS) proteins, IRS-1 and IRS-2, mediate different biological functions in vitro and in vivo, suggesting specific signalling properties despite their high degree of homology. To identify mechanisms contributing to the differential signalling properties of IRS-1 and IRS-2 in the mediation of insulin/IGF-1 action, we performed comprehensive mass spectrometry (MS)-based phosphoproteomic profiling of brown preadipocytes from wild type, IRS-1-/- and IRS-2-/- mice in the basal and IGF-1-stimulated states. We applied stable isotope labeling by amino acids in cell culture (SILAC) for the accurate quantitation of changes in protein phosphorylation. We found ~10% of the 6262 unique phosphorylation sites detected to be regulated by IGF-1. These regulated sites included previously reported substrates of the insulin/IGF-1 signalling pathway, as well as novel substrates including Nuclear Factor I X and Semaphorin-4B. In silico prediction suggests the protein kinase B (PKB), protein kinase C (PKC), and cyclin-dependent kinase (CDK) as the main mediators of these phosphorylation events. Importantly, we found preferential phosphorylation patterns depending on the presence of either IRS-1 or IRS-2, which was associated with specific sets of kinases involved in signal transduction downstream of these substrates such as PDHK1, MAPK3, and PKD1 for IRS-1, and PIN1 and PKC beta for IRS-2. Overall, by generating a comprehensive phosphoproteomic profile from brown preadipocyte cells in response to IGF-1 stimulation, we reveal both common and distinct insulin/IGF-1 signalling events mediated by specific IRS proteins.

Keywords: Insulin receptor substrate; Insulin/IGF-1; Kinase; Phosphoproteomics; Signal transduction.


Conflict of interest statement

Competing interests: The authors declare no competing financial interests.

Figures

Fig. 1
Fig. 1
Experimental strategy and labeling procedure. (A) schematic view of experimental procedure; brown preadipocytes were isolated and immortalized from brown adipose tissue of wild type (WT), IRS-1−/− and IRS-2−/− transgenic knockout mice models. SILAC technology was applied by using the stable heavy, light, and medium isotopes of lysine and arginine to differentially label the proteins at different conditions. Cells were grown in the SILAC medium for several generations. The three populations were harvested either after 5 min IGF-1 stimulation or with no treatment and were mixed equally one to one. Next, the peptides were separated using strong cation exchange (SCX) chromatography and the phosphopeptides were enriched on the TiO2 column and analyzed by high-resolution tandem mass spectrometry. The raw spectra were processed using MaxQuant. (B) ‘double/triple’ SILAC labeling experimental layout; Double design: the left experimental design was used as a control for investigating the changes in cellular phosphorylation after 5 min IGF-1 treatment in WT cells. The middle and right experimental setups were used to gain more insight into the different branches of insulin/IGF-1 signalling downstream of IRS-1 and IRS-2 proteins. Triple design: the non- stimulated cell population (Arg0 and Lys0) was compared with cells stimulated with IGF-1 (medium labeled; Arg6 and Lys4/heavy labeled; Arg10 and Lys8) for 5 min.
Fig. 2
Fig. 2
Quantification of the IGF-1-regulated phosphoproteome. (A) Identified phosphosites; clustered bars represent the number of up- (≥ 1.5 folds), down- (≤ 0.5 folds), and non- regulated phosphosites (0.5-1.5 folds) that were quantified in at least two experimental setups. The number of quantified phosphosites is shown both at global level as well as in each individual cell population. (B) Regulated phosphosites; the number of regulated phosphosites and the overlap among the three cell lines is visualized using Venn Diagram Plotter.
Fig. 3
Fig. 3
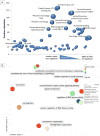
Domain and Pathway enrichment of the IGF-1 regulated phosphoproteome. (A) visualization of over-represented protein domains; bubble plot represents the enriched protein domains of globally phosphoregulated proteins which are identified by DAVID Bioinformatics Resources 6.7. The Y axis represents the number of proteins which include the specific domain. The bigger the bubble size is, the smaller the p-value is, indicating a more significant enrichment of the protein domain among others. (B) REVIGO scatterplot of regulated GO terms in wild type brown preadipocytes; regulated GO terms after 5 minutes of IGF-1 stimulation were summarized and visualized using the REVIGO web server. The color of an individual bubble indicates the p-value enrichment of the GO term. The size of the bubble representing the GO term shows the frequency of occurrence of that term in the underlying GO annotation database. Semantic space is based on the semantic similarity, which is the connection degree between two entities by measuring the similarity of their annotation meanings. The list of enriched GO terms is subjected to medium redundancy reduction in REVIGO and is represented by cluster representatives in a scatterplot. The X and Y axes of the scatter plot represent the distance between the terms between these cluster representatives.
Fig. 4
Fig. 4
Insulin/IGF-1 signalling map. Non-phosphorylated proteins, non-regulated phosphoproteins, and regulated phosphoproteins are mapped to the pathway. The complete list of the proteins involved in insulin/IGF-1 pathway can be found in Table S5. Proteins known to be involved in insulin/IGF-1 pathway are represented in blue color; IRS-1 and IRS-2 are shown in beige color. Identified phosphosites by MS are shown in light orange, previously reported sites; light green, novel sites. The IGF-1 induced upregulated sites are shown with the surrounding red dash lines and the downregulated sites are marked with dark green dashed-circles. The inhibitory and positive relationship between different nodes of the signalling network is shown by orange and solid black arrows, respectively. The dashed lines point the same proteins located at different cell compartments, and dashed arrows indicate the final functional outputs of the pathway.
Fig. 5
Fig. 5
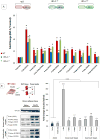
Validation of novel targets of the insulin/IGF-1 signalling pathway. (A) in vitro; quantification of western blot analysis of proteins from WT, IRS-1−/−, and IRS-2−/− brown preadipocytes stimulated with 100 nM of IGF-1 for 5 minutes vs no treatment as control ; n= 3 biological replicates. Values are mean ± SD. *indicates vs. control no-treatment (p ≤ 0.03) analyzed by unpaired t-tests. (B) in vivo; western blot analysis of proteins from brown adipose tissue of WT mice injected with 1 unit of insulin/saline for 5 minutes; n= 6 mice per condition. The left panel visualizes representative blots and the right panel represents the western blot quantification. The vertical axis shows the fold change of protein phosphorylation upon 5 min insulin treatment compared to saline injection. Values are mean ± SD. *indicates vs. control saline (p ≤ 0.03) analyzed by unpaired t- tests.
Fig. 6
Fig. 6
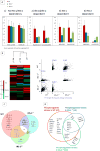
IRS-1 and IRS-2 mediated redundant and unique signalling events. (A) Different categories of IGF-1 regulated phosphoproteins in WT cells (red bars), IRS-1−/− cells (blue bars) and IRS-2−/− cells (green bars); values are gmean ± SD from MS data (n= 5–7), we termed the “upregulated” proteins the proteins for which the phosphorylation ratio after IGF-1 stimulation was increased by ≥ 1.5 fold as compared to basal and phosphoproteins with a ≤ 0.5 fold change were termed as “downregulated”. Phosphosites with a ratio of less than 1.5 and more than 0.5 were not considered as regulated. 1) IGF-1 regulated phosphorylation sites independent of IRS-1 and IRS-2 proteins, i.e. with phosphoregulation occurring in all cell lines stimulated with IGF-1; 2) IGF-1 regulated phosphorylation sites, for which the optimal regulation depends on the presence of both IRS-1 and IRS-2 proteins, this group of phosphorylation sites is defined by an absence of regulation in both IRS-1−/− cells and IRS-2−/− cells as compared to WT cells stimulated with IGF-1; 3) IGF-1 regulated phosphorylation sites which preferentially depend on the presence of IRS-1, this category is defined by an absence of regulation in IRS-1−/− cells as compared to WT and IRS-2−/− cells; 4) IGF-1 regulated phosphosites which preferentially depend on IRS-2, defined by a similar regulation in WT and IRS-1−/− cells but absent in IRS-2−/− cells. (B) Correlation of protein phosphorylation between three cell lines; the left panel shows the hierarchical clustering of protein phosphorylation in three cell populations using Perseus (Max Quant). The IGF-1 regulated phosphoproteomes in WT and IRS-2−/− cells are coclustered. On the right panel, the multi scatter plot from Perseus (Max Quant) is used to visualize the correlation between the three cell lines using MS- acquired quantitative values of phosphosites. The correlation number is shown by R- squared (R2) which might range between 0 and 1. The R-squared of ~0.2 indicates a higher correlation between the phosphoproteomes of WT and IRS-2−/− cells as compared to any other possible combination. (C) Over-represented consensus motifs; the motif-X algorithm was used to determine over-represented sequence motifs from the regulated phosphoproteome dataset, using the mouse database as background. We applied an 11 amino acid residue sequence window surrounding the phosphorylated Serine. Only motifs with p < 10−6 were allowed. Venn Diagram Plotter was used to visualize the overlap of over-represented phosphomotifs among the three cell lines. (D) Unique and common IGF-1 phosphoregulated kinases are shown in WT, IRS-1−/−, and IRS-2−/− cells.
Fig. 7
Fig. 7
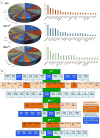
IRS-specific kinome. (A) Prediction of kinases in charge of IGF-1 induced regulation of phosphorylation; NetworKIN was used to predict the kinases which are potential to phosphorylate the IGF-1 regulated residues in WT, IRS-1−/−, and IRS-2−/− cells, ~80-90% of the phosphorylation sites in each cell population were successfully mapped to their potential kinases. The Venn diagrams on the left panel represent the major kinase families predicted by NetworKIN in each cell population, the clustered bars on the right panel show the top 20 kinase members predicted by NetworKIN in each cell line. (B) Kinome network; a temporal kinase-cascade model was generated by linking site-specific kinases that were found regulated upon 5 min IGF-1 stimulation (in blue boxes) with their predicted upstream kinases by NetworKIN (in orange boxes). Kinases regulated by IGF-1 in all three cell lines are depicted as dark blue and common kinases predicted by NetworKIN in all the three cell populations are shown in dark orange boxes.

Similar articles

Cited by

References

    1. Belfiore A, Frasca F, Pandini G, Sciacca L, Vigneri R. Insulin receptor isoforms and insulin receptor/insulin-like growth factor receptor hybrids in physiology and disease. Endocr Rev. 2009;30(6):586–623. - PubMed
    1. Cai W, Sakaguchi M, Kleinridders A, Gonzalez-Del Pino G, Dreyfuss JM, O’Neill BT, Ramirez AK, Pan H, Winnay JN, Boucher J, Eck MJ, Kahn CR. Domain-dependent effects of insulin and IGF-1 receptors on signalling and gene expression. Nature Communications. 2017;8:14892. - PMC - PubMed
    1. White MF. The IRS-signalling system: a network of docking proteins that mediate insulin action. Mol Cell Biochem. 1998;182(1–2):3–11. - PubMed
    1. Krüger M, Kratchmarova I, Blagoev B, Tseng YH, Kahn CR, Mann M. Dissection of the insulin signaling pathway via quantitative phosphoproteomics. Proceedings of the National Academy of Sciences. 2008;105(7):2451–2456. - PMC - PubMed
    1. Taniguchi CM, Emanuelli B, Kahn CR. Critical nodes in signalling pathways: insights into insulin action. Nat Rev Mol Cell Biol. 2006;7(2):85–96. - PubMed

MeSH terms