. 2018 Mar 11;10(3):125.
doi: 10.3390/v10030125.

Human Parainfluenza Virus Type 3 Matrix Protein Reduces Viral RNA Synthesis of HPIV3 by Regulating Inclusion Body Formation

Affiliations

Human Parainfluenza Virus Type 3 Matrix Protein Reduces Viral RNA Synthesis of HPIV3 by Regulating Inclusion Body Formation

Shengwei Zhang et al. Viruses. .

Abstract

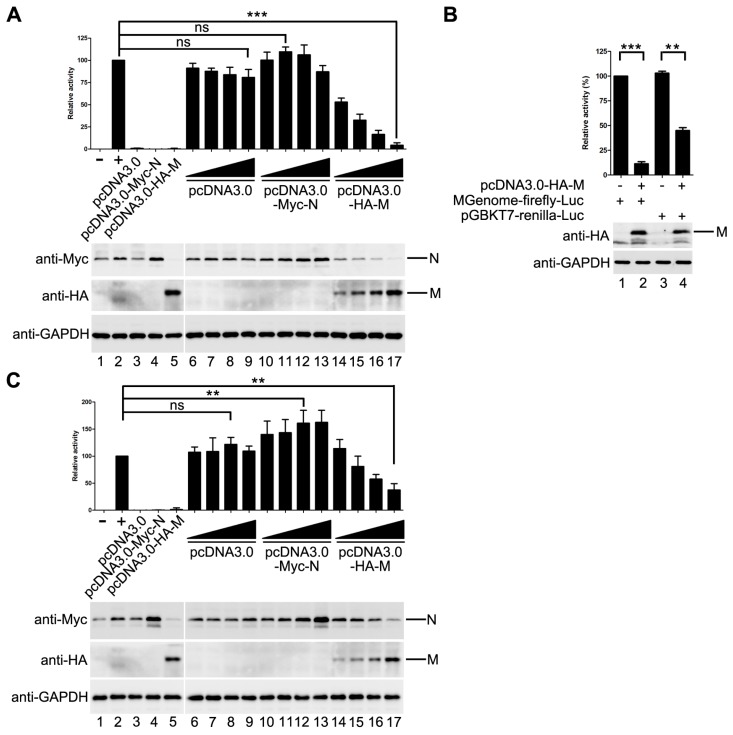
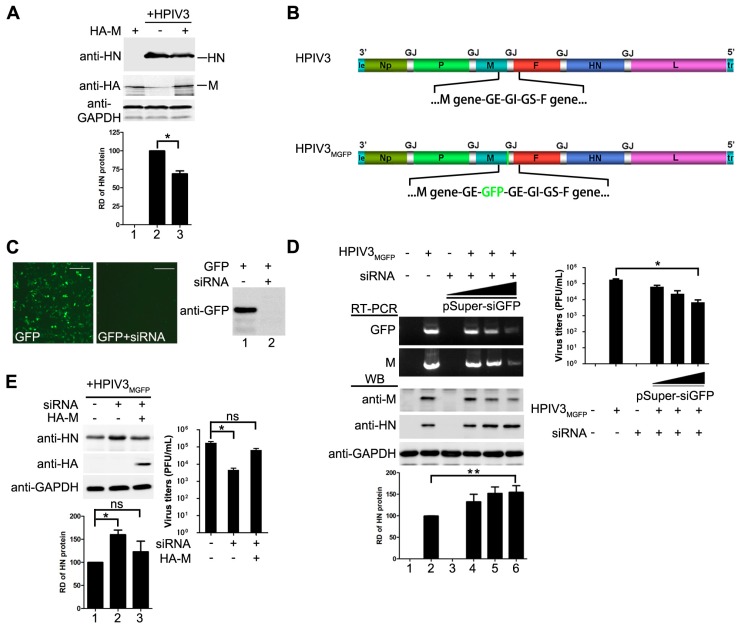
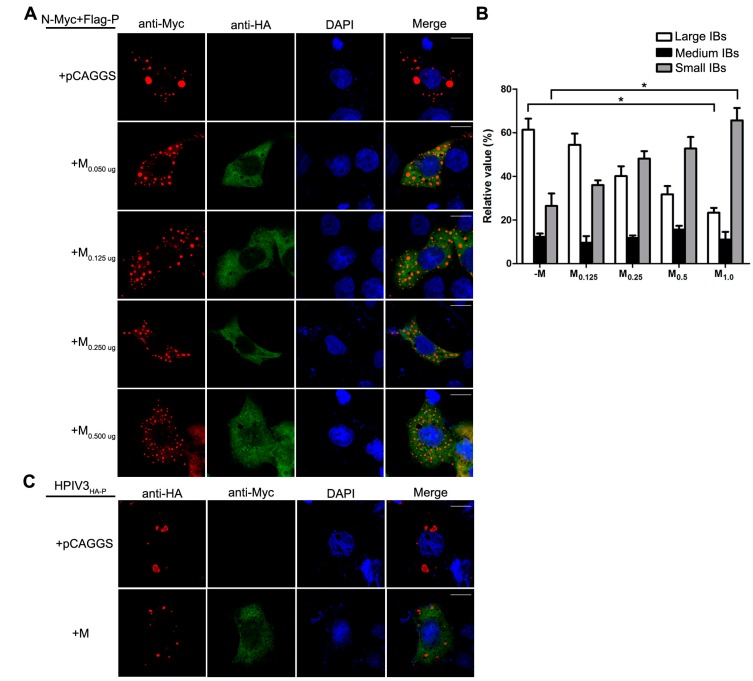
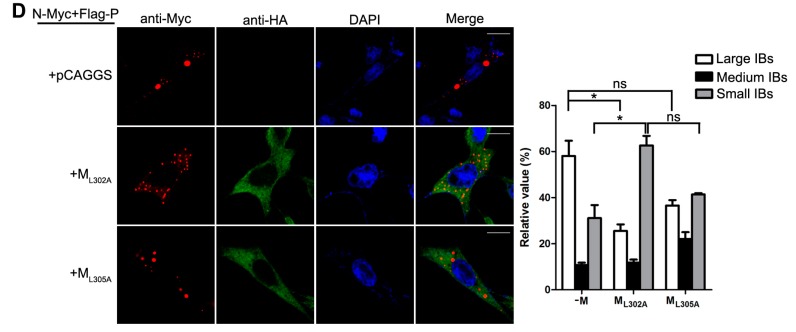
Human parainfluenza virus type 3 is one of the main causes of lower respiratory illness in newborns and infants. The role of the matrix protein (M) in viral budding is extensively studied, but the effect of M on viral replication remains to be determined. Using an HPIV3 minigenome assay, we found that M reduced HPIV3 mingenome-encoded reporter activity even though it had an unspecific effect on the expression of cellular genes. Furthermore, the inhibition effect of M on viral RNA synthesis was proven to be independent of its virus-like particles (VLPs)' release ability. A VLP's defective mutant (ML302A) decreased the expression of minigenome reporter as wild type M did. Using an immunofluorescence assay, we found that M weakened the formation of inclusion bodies (IBs), although it did not co-localize with the IBs. Moreover, using another mutant, ML305A , which is defective in M-nucleoprotein (N) interaction, we found that ML305A had no effect on reporter activity and IB formation as the wild type of M did. Taken together, we conclude that M reduces the replication of HPIV3 and IB formation by M-N interaction.

Keywords: M–N interaction; human parainfluenza virus type 3; inclusion body formation; viral replication; virus-like particles.


Conflict of interest statement

The authors declare that they have no conflicts of interest with the contents of this article.

Figures

Figure 1
Figure 1
M decreases minigenome reporter activity. (A) the effect of M on minigenome-encoded reporter RNA synthesis. vTF7-3-infected HeLa cells were transfected with plasmids encoding N (125 ng), P (62.5 ng), L (100 ng) and minigenome (50 ng) and increasing amounts of pcDNA3.0 vector or plasmids encoding M and N (100, 200, 400, 800 ng). The amount of plasmids was kept constant by pGBKT7. Relative luciferase activity was measured according to the manufacturer’s instructions. The expression of M and N were detected via Western blot with anti-HA and anti-Myc antibody respectively. GAPDH was used as a loading control. Values are means ± SD from three experiments; Student’s t test: *** p < 0.001, ns = not significant. “+,−” means with or without transfecting P plasmid. (B) M has an effect on the expression of T7-promoter driven renilla luciferase. Plasmid encoding renilla luciferase (5 ng) and plasmids encoding N, P, L and minigenome were transfected alone or together with 800 ng pcDNA3.0-HA-M in vTF7-3-infected HeLa cells. Relative luciferase activity was measured and the expression of M was detected via Western blot with anti-HA antibody.Values are means ± SD from three experiments; Student’s t test: ** p < 0.01, *** p < 0.001, “+,−” means with or without transfecting corresponding plasmids. (C) M decreases minigenome-encoded reporter RNA synthesis. Plasmids encoding N (125 ng), P (62.5 ng), L (100 ng), minigenome (50 ng) and renilla luciferase (5 ng) were transfected with increasing amounts of of pcDNA3.0 vector or plasmids encoding M and N (100, 200, 400, 800 ng) in vTF7-3-infected HeLa cells. The amount of plasmids was kept constant by pGBKT7. The activities of firefly luciferase and renilla luciferase were measured according to the manufacturer’s instructions. Relative activity of firefly luciferase to renilla luciferase was calculated and the expression of M was detected via Western blot as described for (A). Values are means ± SD from three experiments. Student’s t test: ** p < 0.01, ns = not significant. “+,−” means with or without transfecting P plasmid.
Figure 2
Figure 2
M reduces HPIV3 replication. (A) over-expression of M reduces the replication of HPIV3. HeLa cells were transfected with vector or plasmids encoding M (2 µg). At 24 hpt, the cells were infected with HPIV3. At 48 hpt, the cells were harvested and lysed for Western blot. Quantity one software was used to quantify the band intensities of HN in the lysates. Values are means ± standard deviations (SD) from three independent experiments. Student’s t test: * p < 0.05; “+,−” means with or without transfecting M plasmid. (B) genomic structure of HPIV3GFP generated in this study. A GFP gene was inserted into the gene end of M and the recombinant virus was rescued as described in Materials and Methods; (C) validity test of pSuper-siGFP. Plasmid encoding GFP (50 ng) was transfected alone or together with 2 µg of pSuper-siGFP in HeLa cells. At 24 hpt, the cells were subjected to fluorescence detection and Western blot assay;“+,−” means with or without transfecting corresponding plasmids. Scale bar, 100 µm. (D) knocking down of M slightly promotes the replication of HPIV3 and extensively reduces viral budding. HeLa cells were transfected with increasing amounts of pSuper-siGFP (0.5 µg, 1 µg, 2 µg). At 24 hpt, the cells were infected with HPIV3MGFP. At 48 hpi, half of the cells were collected for RNA extraction. RT-PCR was used to confirm the effect of siGFP on the transcription of M-GFP mRNA. The other half of cells was lysed for Western blot to detect the expression of M and HN. Supernatants were harvested for titer determination. Quantity one software was used to quantify the band intensities of HN in the lysates. Values are means ± standard deviations (SD) from three independent experiments. Student’s t test: * p < 0.05, ** p < 0.01; “+” means positive transfected or infected corresponding plasmids or viruses. “−” means negative transfected or infected corresponding plasmids or viruses. (E) re-expression of M rescues viral titer and counteracts effect of pSuper-siGFP knockdown. HeLa cells were transfected with 2 µg of pSuper-siGFP. At 24 hpt, the cells were infected with HPIV3MGFP. At 24 hpi, HeLa cells were transfected with 1 µg of pcDNA3.0 vector or pcDNA3.0-HA-M. At 48 hpi, cells were harvested and lysed for Western blot assay. Supernatants were harvested for titer determination. Quantity one software was used to quantify the band intensities of HN in the lysates. Values are means ± standard deviations (SD) from three independent experiments. Student’s t test: * p < 0.05, ns = not significant. “+,−” means with or without transfecting corresponding plasmids.
Figure 3
Figure 3
The inhibitory activity of M is independent of its VLP release. vTF7-3-infected HeLa cells were transfected with plasmids encoding N, P, L, minigenome, renilla luciferase and M or M mutants. Relative luciferase activity was measured and the expression of M was detected via Western blot as described for Figure 1C. Values are means ± SD from three experiments. Student’s t test: * p < 0.05, ** p < 0.01. “+,−” means with or without transfecting P plasmid.
Figure 4
Figure 4
M reduces the formation of IBs. (A) the effect of M on IB formation. HeLa cells were transfected with plasmids encoding N and P alone or together with increasing amounts of pCAGGS-HA-M (50, 125, 250, 500 ng). At 24 hpt, cells were fixed and stained with antibodies against Myc and HA and visualized via confocal microscopy as described in Material and Methods. DAPI was used to stain the nuclear; Scale bar, 10 µm. (B) the quantifications of large, medium and small IBs relative to IBs of all sizes in M transfected cells. The cross-sectional areas of IBs in (A) were measured. Large, medium, and small IBs were quantified in at least 50 cells for each group. The graph shows the percentages of large, medium, and small IBs to IBs of all sizes. Values are means ± standard deviations (SD) from three experiments; Student’s t test: * p < 0.05. (C) M regulates IB formation in HPIV3-infected cells. HeLa cells were transfected with plasmid encoding M. At 24 hpt, cells were infected with HPIV3HA-P. At 48 hpi, cells were fixed for immunofluorescence assay as described in (A); Scale bar, 10 µm. (D) the effect of M mutant on the formation of IBs. HeLa cells were transfected with plasmids encoding N and P alone or together with ML302A or ML305A. At 24 hpt, cells were fixed for immunofluorescence assay as described in (A). The quantifications of large, medium and small IBs relative to IBs of all sizes were calculated as described in (B). Values are means ± standard deviations (SD) from three independent experiments. Student’s t test: * p < 0.05, ns = not significant. Scale bar, 10 µm. “+” means with transfecting corresponding plasmids in (A,C,D).
Figure 4
Figure 4
M reduces the formation of IBs. (A) the effect of M on IB formation. HeLa cells were transfected with plasmids encoding N and P alone or together with increasing amounts of pCAGGS-HA-M (50, 125, 250, 500 ng). At 24 hpt, cells were fixed and stained with antibodies against Myc and HA and visualized via confocal microscopy as described in Material and Methods. DAPI was used to stain the nuclear; Scale bar, 10 µm. (B) the quantifications of large, medium and small IBs relative to IBs of all sizes in M transfected cells. The cross-sectional areas of IBs in (A) were measured. Large, medium, and small IBs were quantified in at least 50 cells for each group. The graph shows the percentages of large, medium, and small IBs to IBs of all sizes. Values are means ± standard deviations (SD) from three experiments; Student’s t test: * p < 0.05. (C) M regulates IB formation in HPIV3-infected cells. HeLa cells were transfected with plasmid encoding M. At 24 hpt, cells were infected with HPIV3HA-P. At 48 hpi, cells were fixed for immunofluorescence assay as described in (A); Scale bar, 10 µm. (D) the effect of M mutant on the formation of IBs. HeLa cells were transfected with plasmids encoding N and P alone or together with ML302A or ML305A. At 24 hpt, cells were fixed for immunofluorescence assay as described in (A). The quantifications of large, medium and small IBs relative to IBs of all sizes were calculated as described in (B). Values are means ± standard deviations (SD) from three independent experiments. Student’s t test: * p < 0.05, ns = not significant. Scale bar, 10 µm. “+” means with transfecting corresponding plasmids in (A,C,D).

Similar articles

Cited by

References

    1. Moscona A. Entry of parainfluenza virus into cells as a target for interrupting childhood respiratory disease. J. Clin. Investig. 2005;115:1688–1698. doi: 10.1172/JCI25669. - DOI - PMC - PubMed
    1. Banerjee A.K., Barik S., De B.P. Gene expression of nonsegmented negative strand RNA viruses. Pharmacol. Ther. 1991;51:47–70. doi: 10.1016/0163-7258(91)90041-J. - DOI - PubMed
    1. Hoffman M.A., Banerjee A.K. Precise mapping of the replication and transcription promoters of human parainfluenza virus type 3. Virology. 2000;269:201–211. doi: 10.1006/viro.2000.0223. - DOI - PubMed
    1. Longhi S., Receveur-Brechot V., Karlin D., Johansson K., Darbon H., Bhella D., Yeo R., Finet S., Canard B. The C-terminal domain of the measles virus nucleoprotein is intrinsically disordered and folds upon binding to the C-terminal moiety of the phosphoprotein. J. Biol. Chem. 2003;278:18638–18648. doi: 10.1074/jbc.M300518200. - DOI - PubMed
    1. Myers T.M., Pieters A., Moyer S.A. A highly conserved region of the Sendai virus nucleocapsid protein contributes to the NP-NP binding domain. Virology. 1997;229:322–335. doi: 10.1006/viro.1996.8429. - DOI - PubMed

Publication types

LinkOut - more resources