. 2018 Mar 13;19(3):841.
doi: 10.3390/ijms19030841.

In Vitro Cocktail Effects of PCB-DL (PCB118) and Bulky PCB (PCB153) with BaP on Adipogenesis and on Expression of Genes Involved in the Establishment of a Pro-Inflammatory State

Affiliations

In Vitro Cocktail Effects of PCB-DL (PCB118) and Bulky PCB (PCB153) with BaP on Adipogenesis and on Expression of Genes Involved in the Establishment of a Pro-Inflammatory State

Phealay May et al. Int J Mol Sci. .

Abstract

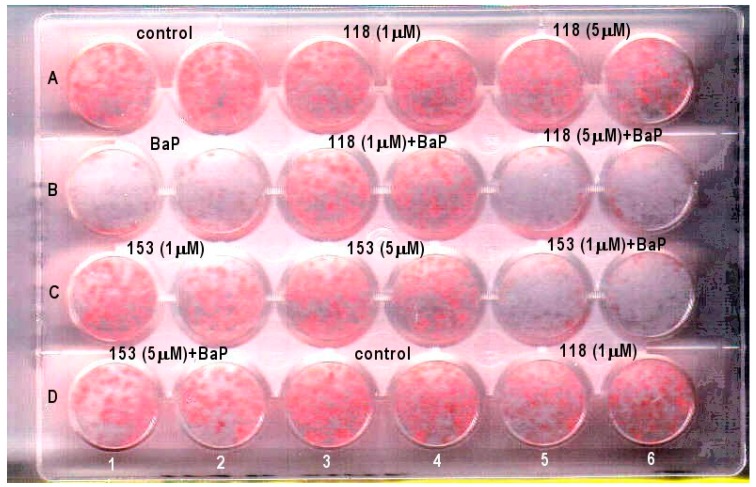
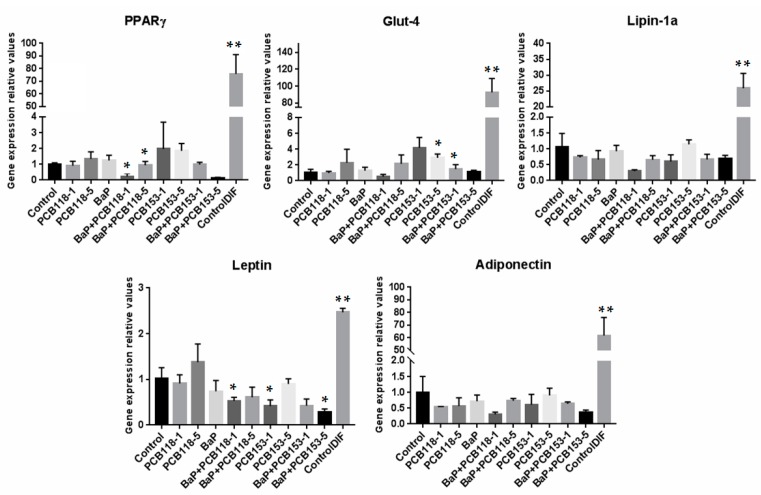
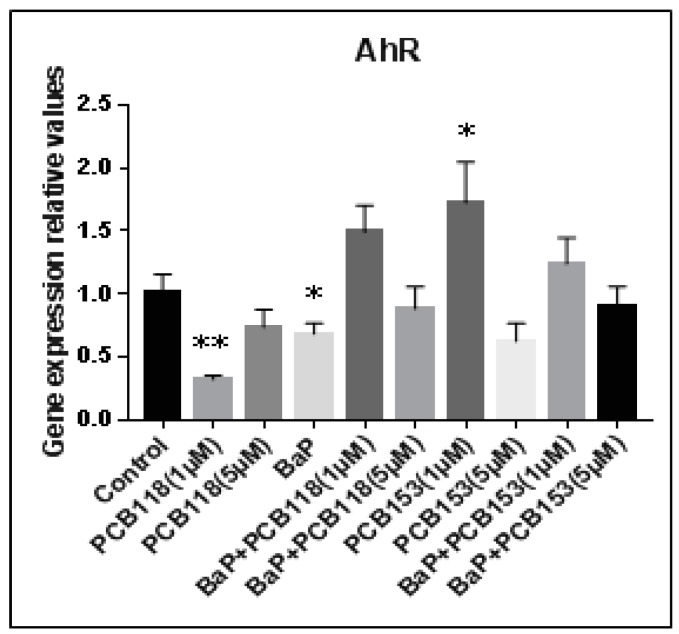
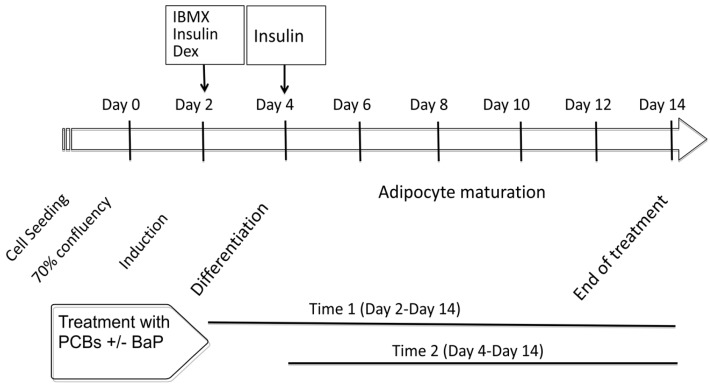
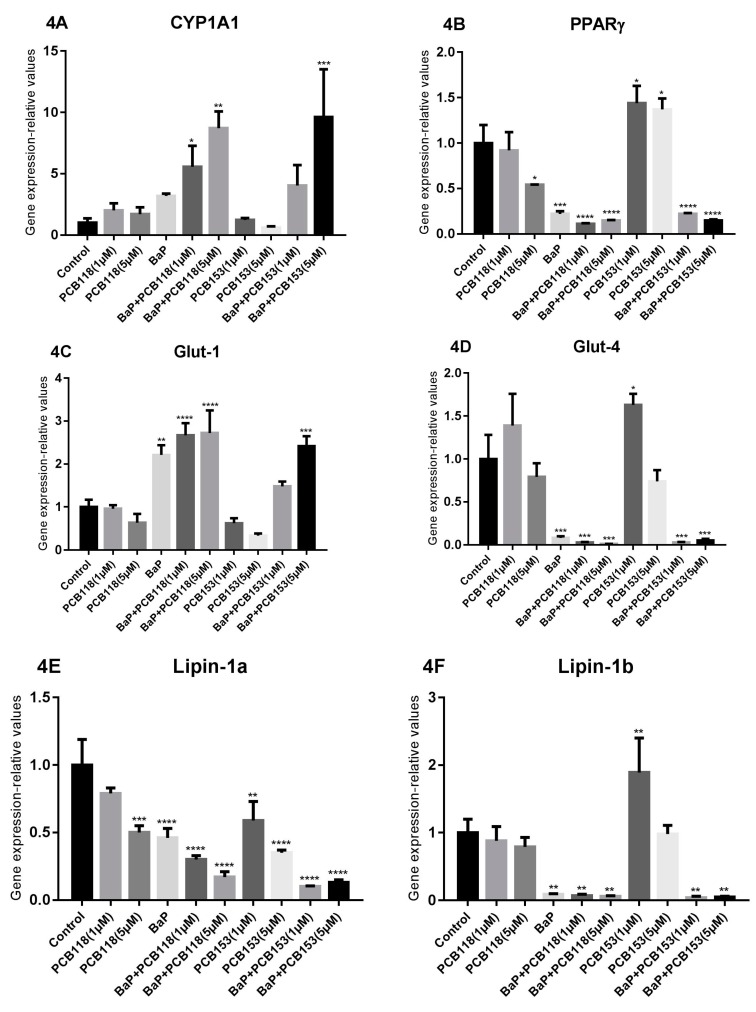
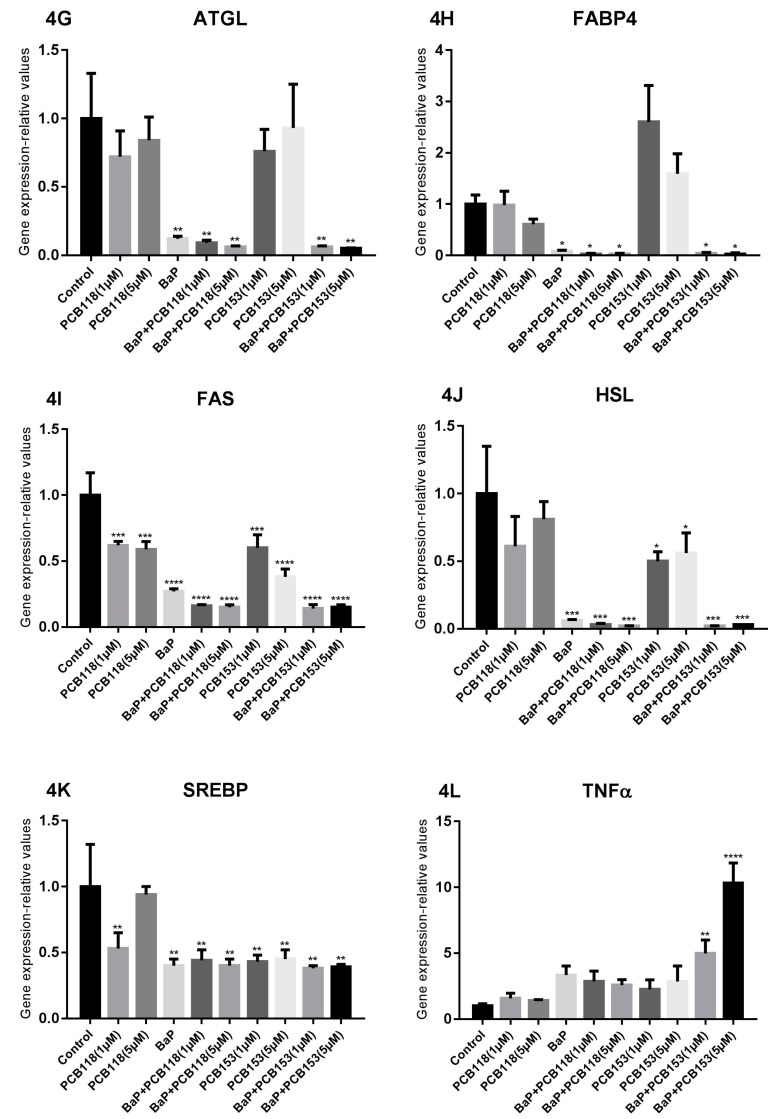
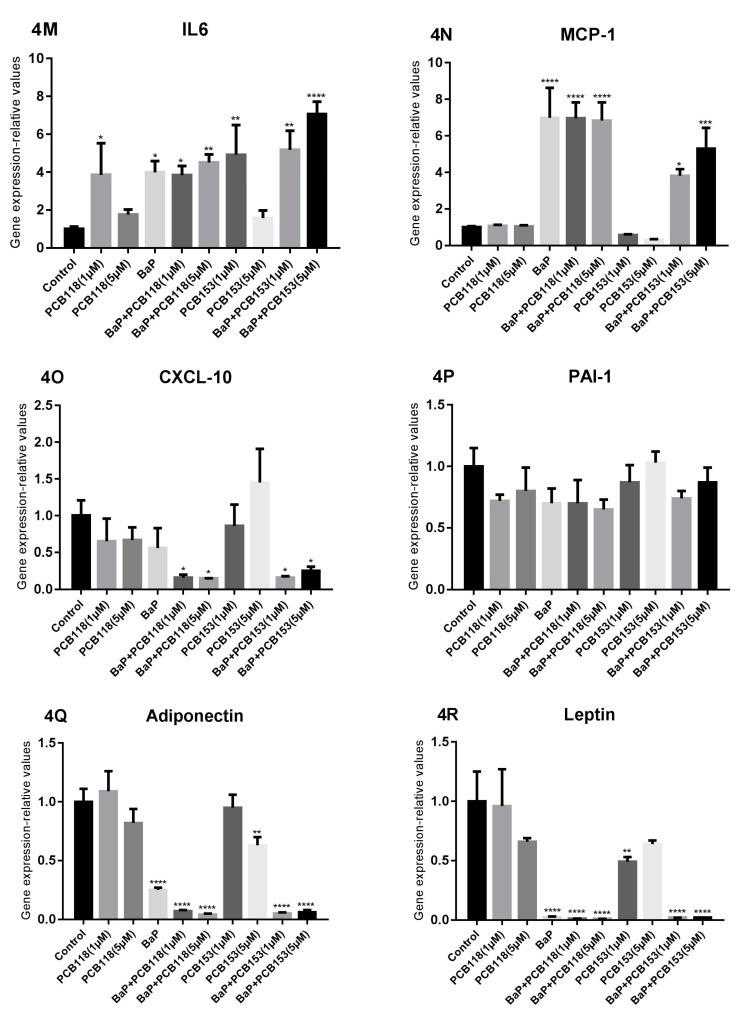
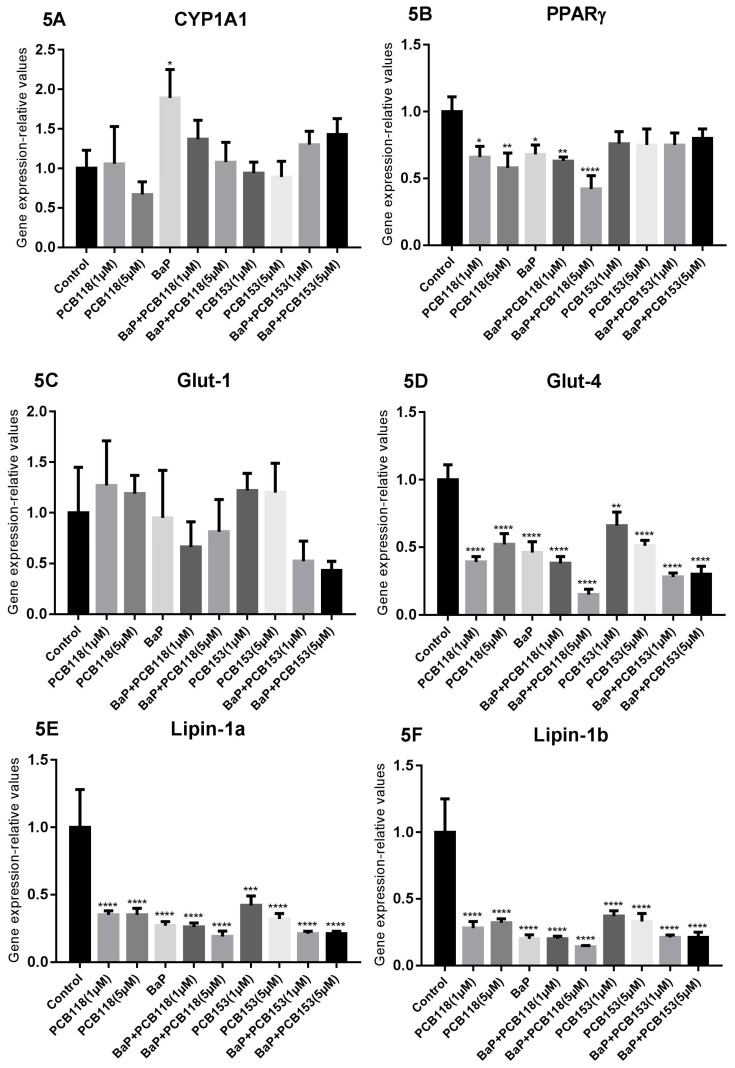
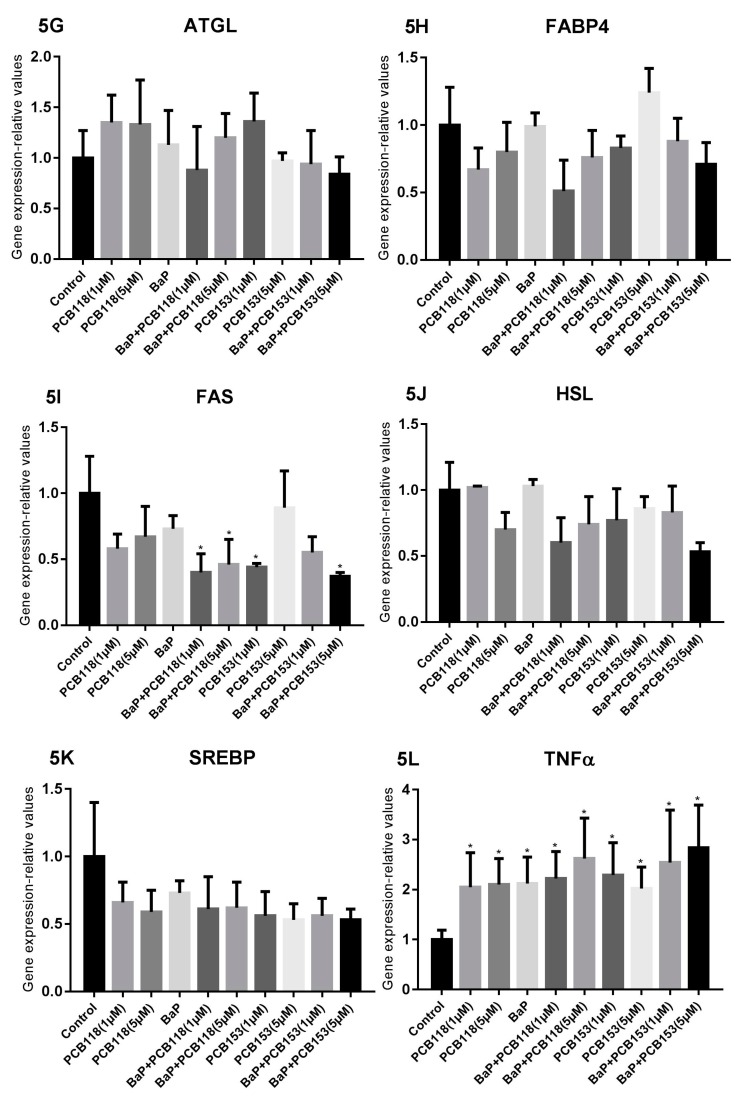
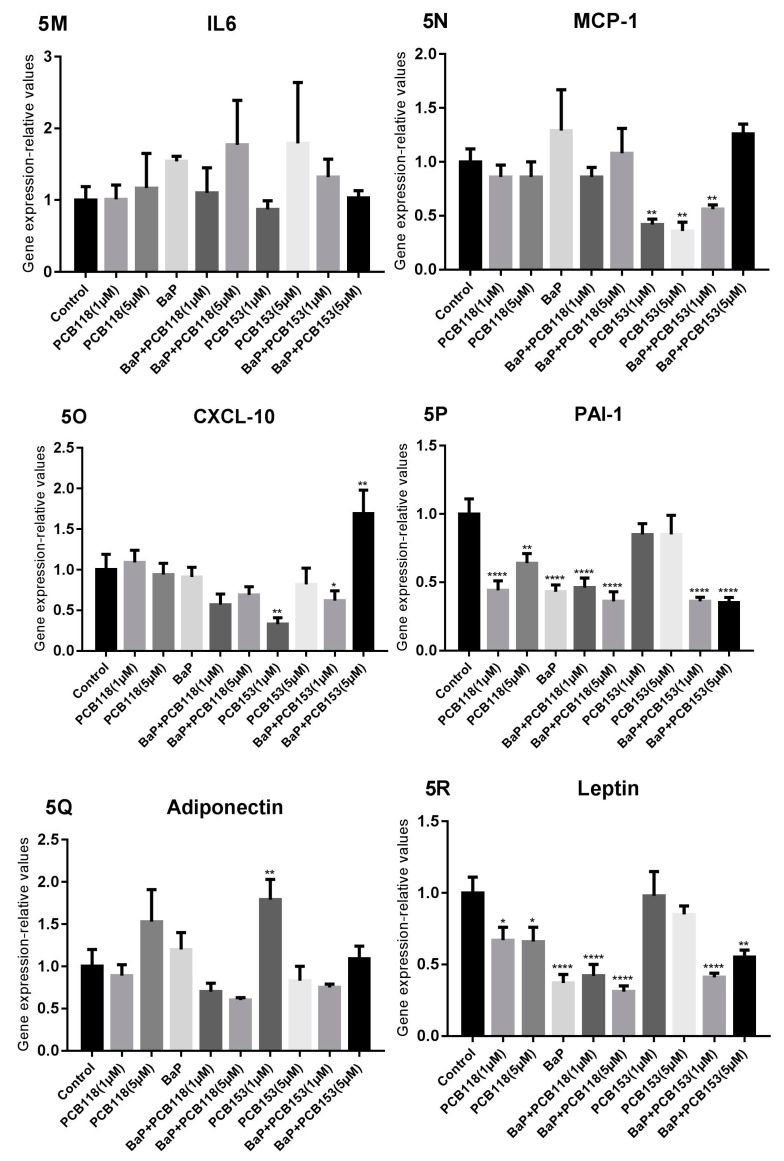
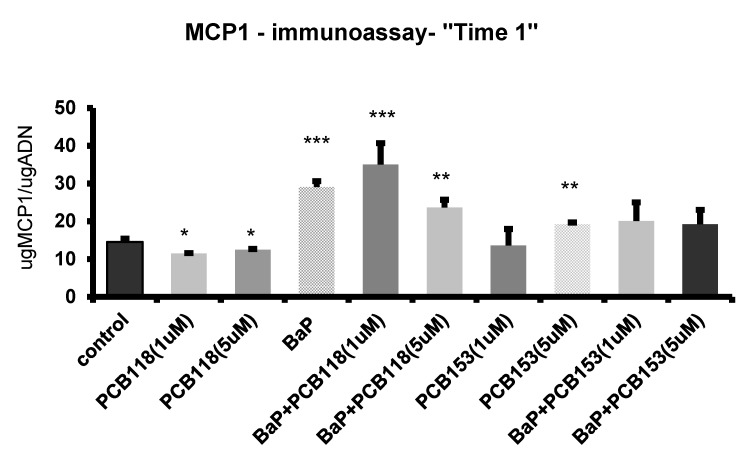
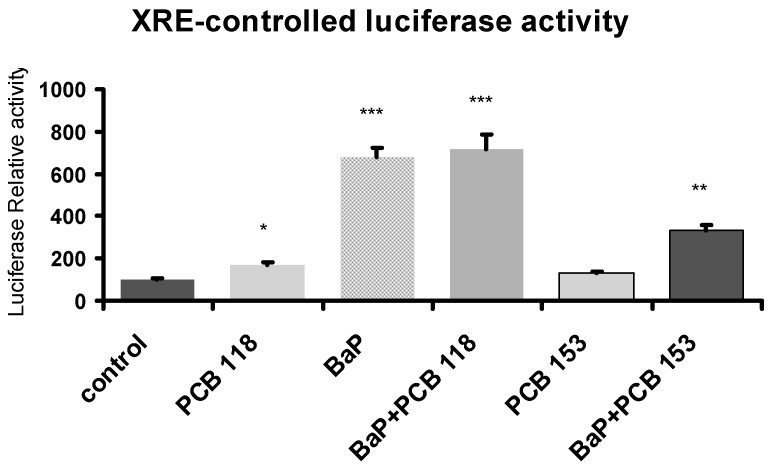
(1) Objective: Highlight the in vitro effects of 3T3-L1 cell exposure to polychlorinated biphenyls (PCB118 and 153) or benzo(a)pyrene (BaP) alone or as a cocktail on adipogenesis (ADG) by focusing on changes in lipid metabolism and inflammatory-related genes expression (INFG) and ADG-related genes expression (ADGG); (2) Results: Treatment from the early stage of cell differentiation by BaP alone or in combination with PCBs decreased the expression of some of the ADGG (PPARγGlut-4, FAS, Lipin-1a, Leptin, and Adiponectin). BaP enhanced the INFG, especially MCP-1 and TNFα. Co-exposure to BaP and PCB153 showed a synergistic effect on TNFα and IL6 expression. Treatment with BaP and PCBs during only the maturation period up-regulated the INFG (IL6, TNFα, CXCL-10 & MCP-1). PCB118 alone also enhanced TNFα, CXCL-10, and PAI-1 expression. The change in MCP-1 protein expression was in agreement with that of the gene. Finally, the BaP-induced up-regulation of the xenobiotic responsive element (XRE)-controlled luciferase activity was impaired by PCB153 but not by PCB118; (3) Conclusion: BaP and PCBs down-regulate a part of ADGG and enhance INFG. The direct regulatory effect of PCBs on both ADGG and INFG is usually rather lower than that of BaP and synergistic or antagonistic cocktail effects are clearly observed.

Keywords: Ah receptor; adipocytes; adipogenesis; benzo(a)pyrene; cocktail effect; inflammation; polychlorobiphenyls (PCB); polycyclic aromatic hydrocarbons.


Conflict of interest statement

The authors declare no conflict of interest. The founding sponsors (PNRPE) had no role in the design of the study; in the collection, analyses, or interpretation of data; in the writing of the manuscript, and in the decision to publish the results.

Figures

Figure A1
Figure A1
Effects of PCB118, PCB153 and BaP on “Oil Red O” staining of adipocytes in Time 1 conditions. 3T3-L1 cells were incubated with or without PCB118 (one or five micromolars) or PCB153 (one or five micromolars) in the presence or not of BaP (one micromolar) according to the “Time 1” or “Time 2” conditions described in materials and methods. The measurement of cellular lipids was carried out using the “Oil Red O” staining method as described under materials and methods.
Figure A2
Figure A2
Effects of PCB118, PCB153 and BaP on undifferentiated 3T3-L1 cells on the expression of various adipogenesis related genes. Undifferentiated 3T3-L1 cells were incubated with or without PCB118 (one or five micromolars) or PCB153 (one or five micromolars) in the presence or not of BaP (one micromolar). Cells were washed twice with PBS and mRNA extraction and qRT-PCR were performed as described under materials and methods. Each incubation condition was carried out in quadriplicate and the experiment was repeated three times with similar results. The data are mean ± SD. The level of significance is given by comparison of treated trials with controls (n = 4 per group): * p < 0.05; ** p < 0.01.
Figure A3
Figure A3
Effects of PCB118, PCB153 and BaP in “Time 1” conditions on the expression of AhR. 3T3-L1 cells were incubated with or without PCB118 (one or five micromolars) or PCB153 (one or five micromolars) in the presence or not of BaP (one micromolar) according to the “Time 1” conditions described in materials and methods. Cells were washed twice with PBS and mRNA extraction and qRT-PCR were performed as described under materials and methods. Each incubation condition was carried out in quadriplicate and the experiment was repeated three times with similar results. The data are mean ± SD. The level of significance is given by comparison of treated trials with controls (n = 4 per group): * p < 0.05; ** p < 0.01.
Figure 1
Figure 1
Treatment schedule of 3T3-L1 cells with benzo(a)pyrene (BaP) and/or polychlorinated biphenyls (PCBs) (PCB118 or PCB153) from the induction of differentiation (Time 1: day 2–day 14) or after differentiation (Time 2: day 4–day 14) to the maturation state (day 14). Dex: dexamethasone. IBMX: 3-isobutyl-1-methylxanthine.
Figure 2
Figure 2
Results of MTT assays performed in “Time 1” and “Time 2” conditions after PCB118 or PCB153 exposure. 3T3-L1 cells were incubated with or without PCB118 (one or five micromolars) or PCB153 (one or five micromolars) according to the “Time 1” or “Time 2” conditions, and MTT assays were performed as described in materials and methods section.
Figure 3
Figure 3
Effects of PCB118, PCB153 and BaP on “Oil Red O” staining of adipocytes ((A) “Time 1”; (B) “Time 2”). 3T3-L1 cells were incubated with or without PCB118 (one of five micromolars) or PCB153 (one or five micromolars) in the presence or not of BaP (one micromolars) according to the “Time 1” or “Time 2” conditions described in materials and methods. The measurement of cellular lipids was carried out using the “Oil Red O” staining method as described under materials and methods. Each incubation condition was carried out in quadriplicate and the experiment was repeated three times. The values are represented as mean ± SD. n = 4 per group. The level of significance is given by comparison of treated trials with controls: * p < 0.05; ** p < 0.001; *** p < 0.0001.
Figure 4
Figure 4
Effects of PCB118, PCB153 and BaP in “Time 1” conditions on the expression of genes related to adipocyte differentiation, glucose and lipid homeostasis, and inflammation. 3T3-L1 cells were incubated with or without PCB118 (one or five micromolars) or PCB153 (one or five micromolars) in the presence or not of BaP (one micromolar) according to the “Time 1” conditions described in materials and methods. Cells were washed twice with PBS and mRNA extraction and qRT-PCR were performed as described under materials and methods. Each incubation condition was carried out in quadriplicate and the experiment was repeated three times with similar results. The data are mean ± SD. The level of significance is given by comparison of treated trials with controls (n = 4 per group): * p < 0.05; ** p < 0.01; *** p < 0.001; **** p < 0.0001.
Figure 4
Figure 4
Effects of PCB118, PCB153 and BaP in “Time 1” conditions on the expression of genes related to adipocyte differentiation, glucose and lipid homeostasis, and inflammation. 3T3-L1 cells were incubated with or without PCB118 (one or five micromolars) or PCB153 (one or five micromolars) in the presence or not of BaP (one micromolar) according to the “Time 1” conditions described in materials and methods. Cells were washed twice with PBS and mRNA extraction and qRT-PCR were performed as described under materials and methods. Each incubation condition was carried out in quadriplicate and the experiment was repeated three times with similar results. The data are mean ± SD. The level of significance is given by comparison of treated trials with controls (n = 4 per group): * p < 0.05; ** p < 0.01; *** p < 0.001; **** p < 0.0001.
Figure 5
Figure 5
Effects of PCB118, PCB153 and BaP in “Time 2” conditions on the expression of genes related to adipocyte differentiation, glucose and lipid homeostasis and inflammation. 3T3-L1 cells were incubated with or without PCB118 (one or five micromolars) or PCB153 (one or five micromolars) in the presence or not of BaP (one micromolar) according to the “Time 2” conditions as described in materials and methods. Cells were washed twice with PBS and mRNA extraction and qRT-PCR were performed as described under materials and methods. Each incubation condition was carried out in quadriplicate and the experiment was repeated three times with similar results. The data are mean ± SD. The level of significance is given by comparison of treated trials with controls (n = 4 per group): * p < 0.05; ** p < 0.01; *** p < 0.001; **** p < 0.0001.
Figure 5
Figure 5
Effects of PCB118, PCB153 and BaP in “Time 2” conditions on the expression of genes related to adipocyte differentiation, glucose and lipid homeostasis and inflammation. 3T3-L1 cells were incubated with or without PCB118 (one or five micromolars) or PCB153 (one or five micromolars) in the presence or not of BaP (one micromolar) according to the “Time 2” conditions as described in materials and methods. Cells were washed twice with PBS and mRNA extraction and qRT-PCR were performed as described under materials and methods. Each incubation condition was carried out in quadriplicate and the experiment was repeated three times with similar results. The data are mean ± SD. The level of significance is given by comparison of treated trials with controls (n = 4 per group): * p < 0.05; ** p < 0.01; *** p < 0.001; **** p < 0.0001.
Figure 6
Figure 6
MCP1 immunoassay “Time 1”. 3T3-L1 cells were incubated with or without PCB118 (one or five micromolars) or PCB153 (one or five micromolars) in the presence or not of BaP (one micromolar) according the “Time 1” conditions described in materials and methods. The conditioned medium was collected and MCP1 peptide was measured by immuno-assay as reported under materials and methods. Each incubation condition was carried out in triplicate and the experiment was repeated three times. The values are mean ± SD. The level of significance is given by comparison of treated trials with controls (n = 4 per group): * p < 0.05; ** p < 0.001; *** p < 0.0001.
Figure 7
Figure 7
Effects of PCB118, PCB153 and BaP on AhR transcriptional activity. Following transfection with a luciferase reporter gene controlled by a xenobiotic esponsive element (XRE) sequence, cells were challenged with PCB118 (five micromolars) or PCB153 (five micromolars) in the presence or not of BaP (one micromolar) according to “Time 1” conditions reported under materials and methods. The values are represented as mean ± SD. n = 4 per group. The level of significance is given by comparison of treated trials with controls (n = 4 per group): * p < 0.05, ** p < 0.01, *** p < 0.001.

Similar articles

Cited by

References

    1. World Health Organization . Global Report on Diabetes. WHO; Geneva, Switzerland: 2016.
    1. Caputo T., Gilardi F., Desvergne B. From chronic overnutrition to metaflammation and insulin resistance: Adipose tissue and liver contributions. FEBS Lett. 2017;591:3061–3088. doi: 10.1002/1873-3468.12742. - DOI - PubMed
    1. Tang M., Chen K., Yang F., Liu W. Exposure to organochlorine pollutants and type 2 diabetes: A systematic review and meta-analysis. PLoS ONE. 2014;9:e85556. doi: 10.1371/journal.pone.0085556. - DOI - PMC - PubMed
    1. Song Y., Chou E.L., Baecker A., You N.C., Song Y., Sun Q., Liu S. Endocrine-disrupting chemicals, risk of type 2 diabetes, and diabetes-related metabolic traits: A systematic review and meta-analysis. J. Diabetes. 2016;8:516–532. doi: 10.1111/1753-0407.12325. - DOI - PubMed
    1. Ovesen J.L., Schnekenburger M., Puga A. Aryl hydrocarbon receptor ligands of widely different toxic equivalency factors induce similar histone marks in target gene chromatin. Toxicol. Sci. 2011;121:123–131. doi: 10.1093/toxsci/kfr032. - DOI - PMC - PubMed

MeSH terms

LinkOut - more resources