. 2018 Apr;28(4):532-546.
doi: 10.1101/gr.225599.117. Epub 2018 Mar 12.

Nucleosomes and DNA methylation shape meiotic DSB frequency in Arabidopsis thaliana transposons and gene regulatory regions

Affiliations

Nucleosomes and DNA methylation shape meiotic DSB frequency in Arabidopsis thaliana transposons and gene regulatory regions

Kyuha Choi et al. Genome Res. 2018 Apr.

Abstract

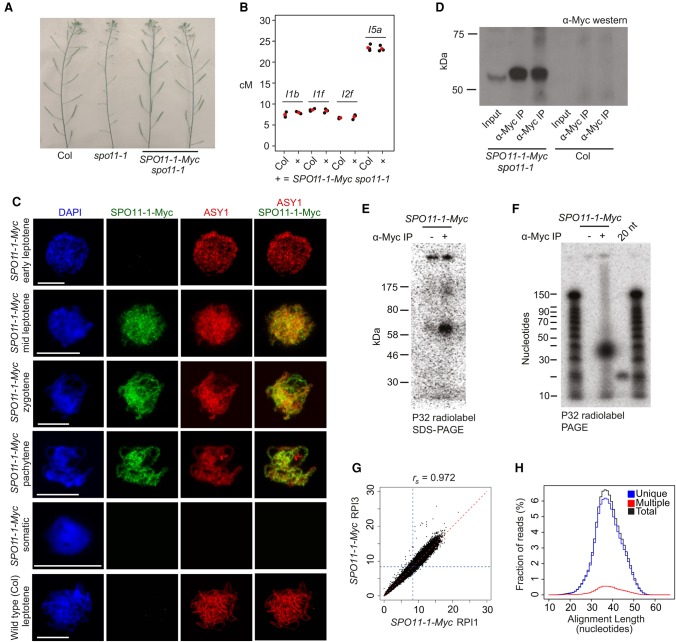
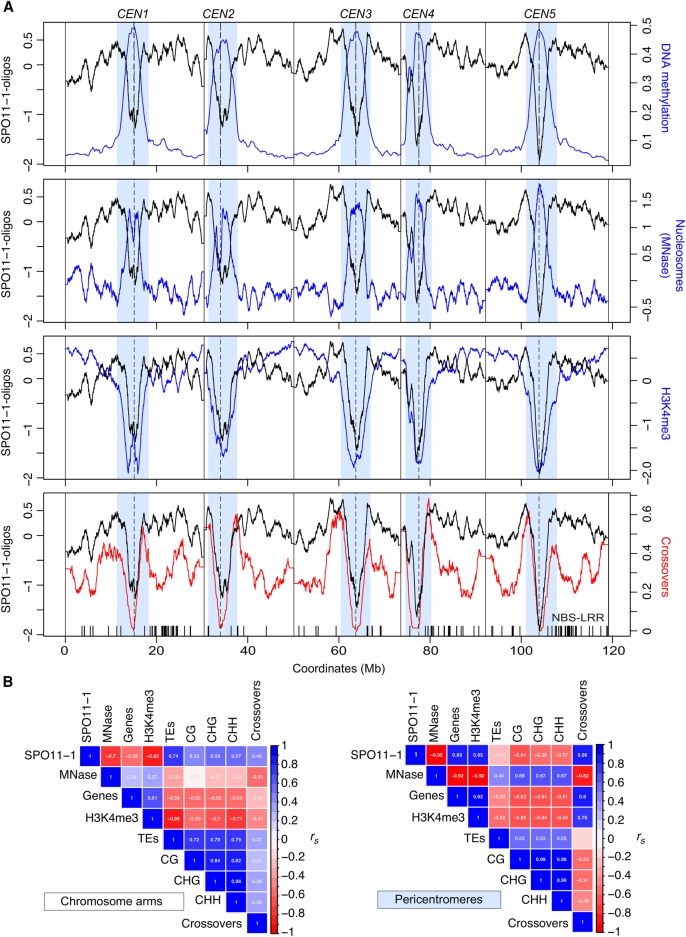
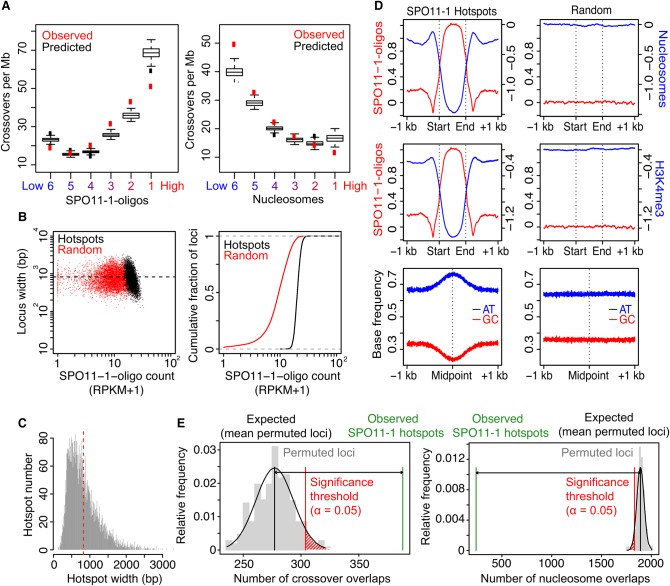
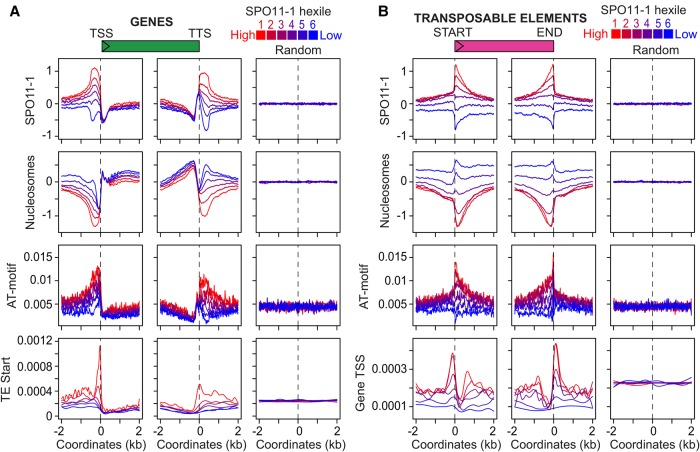
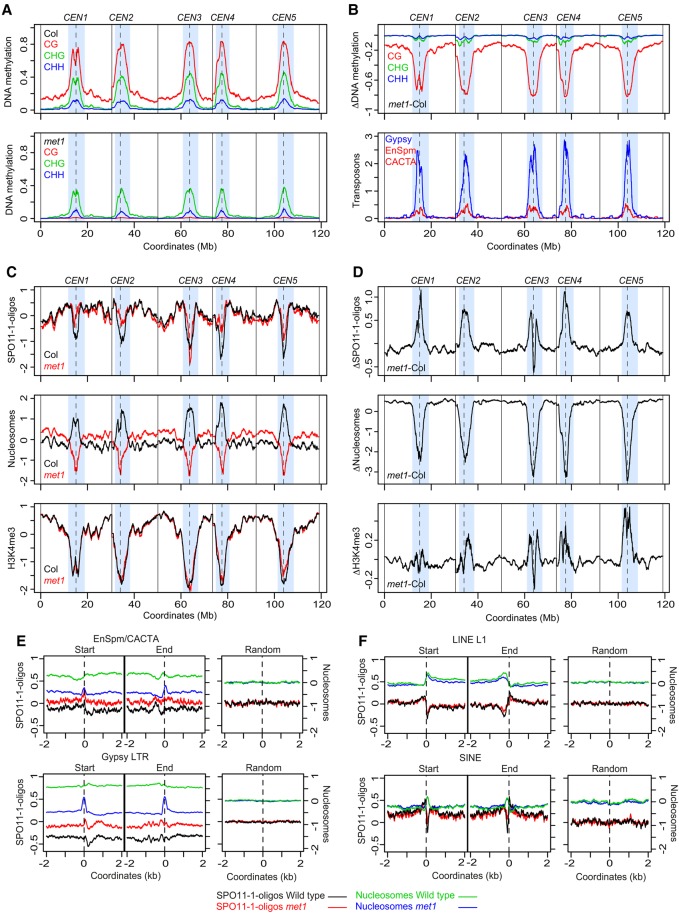
Meiotic recombination initiates from DNA double-strand breaks (DSBs) generated by SPO11 topoisomerase-like complexes. Meiotic DSB frequency varies extensively along eukaryotic chromosomes, with hotspots controlled by chromatin and DNA sequence. To map meiotic DSBs throughout a plant genome, we purified and sequenced Arabidopsis thaliana SPO11-1-oligonucleotides. SPO11-1-oligos are elevated in gene promoters, terminators, and introns, which is driven by AT-sequence richness that excludes nucleosomes and allows SPO11-1 access. A positive relationship was observed between SPO11-1-oligos and crossovers genome-wide, although fine-scale correlations were weaker. This may reflect the influence of interhomolog polymorphism on crossover formation, downstream from DSB formation. Although H3K4me3 is enriched in proximity to SPO11-1-oligo hotspots at gene 5' ends, H3K4me3 levels do not correlate with DSBs. Repetitive transposons are thought to be recombination silenced during meiosis, to prevent nonallelic interactions and genome instability. Unexpectedly, we found high SPO11-1-oligo levels in nucleosome-depleted Helitron/Pogo/Tc1/Mariner DNA transposons, whereas retrotransposons were coldspots. High SPO11-1-oligo transposons are enriched within gene regulatory regions and in proximity to immunity genes, suggesting a role as recombination enhancers. As transposon mobility in plant genomes is restricted by DNA methylation, we used the met1 DNA methyltransferase mutant to investigate the role of heterochromatin in SPO11-1-oligo distributions. Epigenetic activation of meiotic DSBs in proximity to centromeres and transposons occurred in met1 mutants, coincident with reduced nucleosome occupancy, gain of transcription, and H3K4me3. Together, our work reveals a complex relationship between chromatin and meiotic DSBs within A. thaliana genes and transposons, with significance for the diversity and evolution of plant genomes.


Figures

Figure 1.
Figure 1.
Purification and sequencing of A. thaliana SPO11-1-oligonucleotides. (A) Inflorescences from wild type (Col), spo11-1, and SPO11-1-Myc spo11-1. Greater silique length indicates higher fertility. (B) Crossover frequency (cM) measured using fluorescent crossover reporter lines (FTLs I1b, I1f, I2f, and I5a) in wild type (Col) or SPO11-1-Myc spo11-1 (+). Mean values are shown in red. (C) Nuclei from SPO11-1-Myc or wild type (Col) immunostained using α-Myc (green) or α-ASY1 (red) antibodies and stained for DAPI (blue). Scale bars, 10 μM. (D) α-Myc Western blot from SPO11-1-Myc or Col extracts, before and after α-Myc immunoprecipitation (α-Myc-IP). Biological replicate samples are shown. (E) Detection of end-radiolabeled SPO11-1-Myc complexes following immunoprecipitation and SDS polyacrylamide gel electrophoresis (SDS-PAGE). (F) Detection of end-radiolabeled, purified SPO11-1-oligos following proteinase K digestion of immunoprecipitates and polyacrylamide gel electrophoresis (PAGE). A labeled 20-base oligonucleotide (20 nt) was run alongside as a size control. (G) Scatter plot showing correlation of library size normalized SPO11-1-oligo values calculated in adjacent 10-kb windows between wild-type libraries RPI1 and RPI3. Blue dotted lines indicate genome average values. Spearman's rank correlation coefficient (rs) is printed above the plot. (H) Histogram showing lengths of uniquely aligning (blue), multiply aligning (red), and total (black) SPO11-1 reads from library RPI48.
Figure 2.
Figure 2.
Genomic landscape of SPO11-1-oligonucleotides, crossovers, euchromatin, and heterochromatin. (A) SPO11-1-oligos (black, Z-score standardized log2[SPO11-1-oligos/gDNA]), nucleosome occupancy (blue, Z-score standardized log2[MNase/gDNA]) (Choi et al. 2016), and H3K4me3 (blue, Z-score standardized log2[ChIP/input]) levels were calculated in adjacent 10-kb windows and plotted along the A. thaliana chromosomes, using a rolling average. DNA methylation (blue, proportion of methylation in all sequence contexts) (Stroud et al. 2013) and crossovers (red) (Choi et al. 2016; Serra et al. 2018) were analyzed in the same way using 200-kb and 10-kb windows, respectively. The centromeric assembly gaps are indicated by vertical dashed lines, and telomere positions are indicated by vertical solid lines. The pericentromeres are shaded light blue and are defined as regions surrounding the centromere with greater than average DNA methylation. x-Axis ticks indicate the positions of NBS-LRR gene homologs (Choi et al. 2016). (B) Matrices showing Spearman's rank correlation coefficient between the listed parameters, with 10-kb windows used for correlations and shading proportional to the value. Matrices were calculated separately for the chromosome arms and pericentromeres.
Figure 3.
Figure 3.
A. thaliana SPO11-1-oligonucleotide hotspots and crossovers. (A) Plots showing observed (red) overlap of SNP intervals with crossovers per megabase. SNP intervals (n = 479,888) were divided into six groups (hexiles) following ranking by mean SPO11-1-oligo levels (log2[SPO11-1-oligos/gDNA]; group 1 = highest, group 6 = lowest). Data were modeled with the glm2 function in R, using the binomial family with logistic link function and the formula: CO ∼ SPO11-1-oligos + nucleosomes + H3K4me3 + DNA methylation + width + interactions. Using this logistic model, we then obtained the probability of windows within each hexile overlapping a crossover (black box plots). (B) SPO11-1-oligo counts per hotspot (RPKM + 1) plotted against hotspot widths (bp; black) compared with equivalent analysis of random loci of the same number and widths (red). Also shown is a cumulative distribution curve plotting hotspots (black) and random loci (red), according to ranked SPO11-1-oligo counts (RPKM + 1). (C) Histogram of ranger-defined SPO11-1-oligo hotspot widths (bp), with the mean indicated by the red vertical dashed line. (D) Average profiles of SPO11-1-oligos (red, Z-score standardized log2[SPO11-1-oligos/gDNA]), nucleosomes (blue, Z-score standardized log2[MNase/gDNA]), and H3K4me3 (blue, Z-score standardized log2[ChIP/Input]) within SPO11-1-oligo hotspots, scaled to a common width, and in 1-kb flanking windows (left). Equivalent randomly positioned loci were analyzed in the same way (right). Also shown are plots analyzing the relative frequency of AT (blue) and GC (red) bases around SPO11-1-oligo hotspots or random loci. (E) Histograms show the relative frequency distribution of 10,000 sets of permuted (randomly positioned) loci, which are of the same number and widths as the SPO11-1-oligo hotspots, with regard to the number of permuted loci that overlap one or more crossovers (left) or highly positioned nucleosomes (right; gray bars). The number of SPO11-1-oligo hotspots observed (green vertical line) or expected (black vertical line; mean overlaps for permuted loci) to overlap one or more loci, together with the significance threshold (red vertical line; α = 0.05) for a difference between observed and expected overlaps, are indicated.
Figure 4.
Figure 4.
SPO11-1-oligonucleotide enrichment in gene promoter and terminator nucleosome-free regions. (A) Heat maps of SPO11-1-oligos (upper) and nucleosome occupancy (lower) within gene transcriptional units (between transcriptional start [TSS] and termination [TTS] sites) and 2-kb flanking regions. The rows represent individual genes, which have been ordered by descending SPO11-1-oligo values between TSS and TTS. For shading, SPO11-1-oligo and nucleosome values equal to defined quantiles were mapped linearly to a vector of six colors: dark blue (lowest), blue, light blue, yellow, orange, red (highest). (B) Density of SPO11-1-oligos (black; log2[SPO11-1-oligos/gDNA]), nucleosome occupancy (red, nucleosomes; log2[MNase/gDNA]), and H3K4me3 (blue; log2[ChIP/input]) in wild type, across gene transcriptional units (TSS to TTS), and in flanking 2-kb windows. The right-hand column shows results from analysis of the same number of randomly chosen positions. (C) Heat maps as for A, but showing SPO11-1-oligos around genes ordered by descending SPO11-1-oligo levels in gene promoters (upper, 500 bp upstream of TSS) or gene terminators (lower, 500 bp downstream from TTS). (D) Heat maps as for A, but showing nucleosomes around genes ordered by descending SPO11-1-oligo levels in gene promoters (upper), or by descending nucleosome levels within TSS–TTS (lower). (E) Heat maps as for A, but showing H3K4me3 around genes ordered by descending SPO11-1-oligo levels in gene promoters (upper) or by descending H3K4me3 levels within TSS–TTS (lower).
Figure 5.
Figure 5.
Meiotic recombination and chromatin variation between A. thaliana transposons. (A) Pie chart showing A. thaliana transposon families, with slice size proportional to physical length, and color-coded according to SPO11-1-oligo (Z-score standardized log2[SPO11-1-oligos/gDNA]) levels. Inset colored boxes are shaded equivalent to the genome-wide mean (purple), minimum (blue), and maximum (red) values. (B) As for A, but analyzing nucleosome occupancy (Z-score standardized log2[MNase/gDNA]). (C) Box plots showing SPO11-1-oligo and nucleosome occupancy, according to transposon SPO11-1-oligo hexile groups, with horizontal lines indicating the genome average value. Inset pie charts show the proportion of DNA (red) and RNA (blue) transposons for each SPO11-1-oligo transposon hexile. (D) Density of transposons through the A. thaliana genome according to SPO11-1-oligo hexile: (red) highest; (blue) lowest. x-Axis ticks indicate NBS-LRR gene homolog positions. Plotted beneath are SPO11-1-oligos (red) versus the density of Helitron/Pogo/Tc1/Mariner class DNA transposons (blue), or Gypsy RNA transposons (blue).
Figure 6.
Figure 6.
Nucleosomes, AT-sequence motifs, and SPO11-1-oligonucleotides within genes and transposons. (A) Density of SPO11-1-oligos (Z-score standardized log2[SPO11-1-oligos/gDNA]), nucleosome occupancy (Z-score standardized log2[MNase/gDNA]), crossover-enriched AT-motifs (Choi et al. 2013), and TE start coordinates, in 4-kb windows around gene TSSs or TTSs, or the same number of random positions. Genes are grouped according to SPO11-1-oligo promoter or terminator hexile: (red) highest; (blue) lowest. (B) As for A but analyzing transposon SPO11-1-oligo hexiles and showing gene TSS density.
Figure 7.
Figure 7.
Coordinate epigenetic remodeling of chromatin and SPO11-1-oligonucleotides in met1 DNA methylation mutants. (A) Percent DNA methylation in CG (red), CHG (green), and CHH (blue) sequence contexts plotted from wild type (Col) and met1-3 (Stroud et al. 2013). Values were calculated in adjacent 10-kb windows and plotted along the A. thaliana chromosomes, using a rolling average. Centromeric assembly gaps are indicated by vertical dashed lines, and telomere positions are indicated by vertical solid lines. The pericentromeres are shaded light blue, which are defined as regions with greater than average DNA methylation. (B) The wild type (Col) versus met1 DNA methylation differential (Δ, met1 − wild type), plotted as in A (upper). The density of Gypsy (blue) and EnSpm/CACTA (red) transposons are plotted as in A (lower). (C) SPO11-1-oligos (Z-score standardized log2[SPO11-1-oligos/gDNA]), nucleosome occupancy (Z-score standardized log2[MNase/gDNA], blue), and H3K4me3 (Z-score standardized log2[ChIP/Input], blue) plotted as for A, in wild type (Col, black) and met1-3 (red). (D) The wild type (Col) versus met1 SPO11-1-oligo, nucleosome occupancy and H3K4me3 differentials (Δ, met1 − wild type), plotted as in A (upper). (E) Plots analyzing SPO11-1-oligos in wild type (black) and met1 (red), and nucleosomes in wild type (green) and met1 (blue) for EnSpm/CACTA and Gypsy transposons in 4-kb windows around their start and end coordinates, or the same number of randomly chosen positions. (F) As for E, but analyzing LINE L1 and SINE transposons.

Similar articles

Cited by

References

    1. Acquaviva L, Székvölgyi L, Dichtl B, Dichtl BS, de La Roche Saint André C, Nicolas A, Géli V. 2013. The COMPASS subunit Spp1 links histone methylation to initiation of meiotic recombination. Science 339: 215–218. - PubMed
    1. Allers T, Lichten M. 2001. Intermediates of yeast meiotic recombination contain heteroduplex DNA. Mol Cell 8: 225–231. - PubMed
    1. Armstrong SJ, Caryl AP, Jones GH, Franklin FC. 2002. Asy1, a protein required for meiotic chromosome synapsis, localizes to axis-associated chromatin in Arabidopsis and Brassica. J Cell Sci 115: 3645–3655. - PubMed
    1. Baker CL, Walker M, Kajita S, Petkov PM, Paigen K. 2014. PRDM9 binding organizes hotspot nucleosomes and limits Holliday junction migration. Genome Res 24: 724–732. - PMC - PubMed
    1. Baudat F, Buard J, Grey C, Fledel-Alon A, Ober C, Przeworski M, Coop G, de Massy B. 2010. PRDM9 is a major determinant of meiotic recombination hotspots in humans and mice. Science 327: 836–840. - PMC - PubMed

Publication types

MeSH terms

LinkOut - more resources