. 2018 May 11;293(19):7466-7473.
doi: 10.1074/jbc.RA118.001975. Epub 2018 Mar 9.

Mini G protein probes for active G protein-coupled receptors (GPCRs) in live cells

Affiliations

Mini G protein probes for active G protein-coupled receptors (GPCRs) in live cells

Qingwen Wan et al. J Biol Chem. .

Abstract

G protein-coupled receptors (GPCRs) are key signaling proteins that regulate nearly every aspect of cell function. Studies of GPCRs have benefited greatly from the development of molecular tools to monitor receptor activation and downstream signaling. Here, we show that mini G proteins are robust probes that can be used in a variety of assay formats to report GPCR activity in living cells. Mini G (mG) proteins are engineered GTPase domains of Gα subunits that were developed for structural studies of active-state GPCRs. Confocal imaging revealed that mG proteins fused to fluorescent proteins were located diffusely in the cytoplasm and translocated to sites of receptor activation at the cell surface and at intracellular organelles. Bioluminescence resonance energy transfer (BRET) assays with mG proteins fused to either a fluorescent protein or luciferase reported agonist, superagonist, and inverse agonist activities. Variants of mG proteins (mGs, mGsi, mGsq, and mG12) corresponding to the four families of Gα subunits displayed appropriate coupling to their cognate GPCRs, allowing quantitative profiling of subtype-specific coupling to individual receptors. BRET between luciferase-mG fusion proteins and fluorescent markers indicated the presence of active GPCRs at the plasma membrane, Golgi apparatus, and endosomes. Complementation assays with fragments of NanoLuc luciferase fused to GPCRs and mG proteins reported constitutive receptor activity and agonist-induced activation with up to 20-fold increases in luminescence. We conclude that mG proteins are versatile tools for studying GPCR activation and coupling specificity in cells and should be useful for discovering and characterizing G protein subtype-biased ligands.

Keywords: BRET; G protein; G protein–coupled receptor (GPCR); NanoLuc; arrestin; biosensor; mini G protein; molecular pharmacology; protein complementation.


Conflict of interest statement

C. G. T. is a shareholder and member of the scientific advisory board of Heptares Therapeutics

Figures
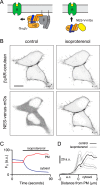
Figure 1.
Figure 1.
Mini G proteins are recruited to active receptors at the plasma membrane. A, cartoon representation highlighting the differences between G protein heterotrimers, which diffuse within the membrane to engage receptors (left), and mG proteins, which diffuse through the cytosol to engage receptors (right). Mini G proteins lack membrane anchors, N-terminal Gβγ-binding surface, and the α-helical domain (HD). B, confocal images of HEK 293 cells expressing cerulean-tagged β2-adrenergic receptors (β2AR-cerulean; top panels) and NES–venus–mGs (bottom panels). NES–venus–mGs is recruited to the plasma membrane after stimulation with 10 μm isoproterenol. Scale bar, 10 μm. C, venus fluorescence (FV, arbitrary units (a.u.)) at the plasma membrane (PM) and in the cytosol plotted against time for the cells shown in B. D, mean NES–venus–mGs fluorescence (± S.E.) line profiles drawn perpendicular to the plasma membrane from the extracellular (e.c.) space to the cytosol in five cells before and after application of isoproterenol. Weak accumulation of NES–venus–mGs at the plasma membrane is detectable prior to stimulation (black arrowhead).
Figure 2.
Figure 2.
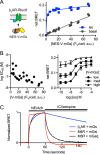
BRET between β2AR–Rluc8 and NES–venus–mGs. A, net BRET is plotted versus mean NES–venus–mGs fluorescence intensity per cell (FV, arbitrary units (a.u.)) for control cells and cells stimulated with 10 μm isoproterenol (iso). Cells were transfected with a constant amount of DNA encoding β2AR–Rluc8, and an increasing amount of DNA encoding NES–venus–mGs. Data are fitted to a two-site–specific binding equation, and data points from three independent experiments are superimposed. B, log EC50 is plotted versus mean NES–venus–mGs fluorescence intensity per cell (FV, arbitrary units) for five independent experiments with five different expression levels each (left). Example concentration-response curves are shown for cells expressing low (EC50 = 116 nm), medium (EC50 = 52 nm), and high (EC50 = 22 nm) levels of NES–venus–mGs (right); mean ± S.E. of three independent experiments. C, normalized BRET is plotted versus time for cells expressing β2AR-, M4R-, and M3R-Rluc8 together with NES–venus–mGs, –mGsi, and –mGsq; acetylcholine (100 μm; Ach), (−)-norepinephrine (10 μm), ICI 118,551 (10 μm), and atropine (10 μm) were added as indicated. Traces are the average of 4–7 experiments.
Figure 3.
Figure 3.
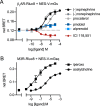
BRET between GPCRs and mG proteins reports the full range of ligand efficacy. Net BRET between β2AR–Rluc8 and NES–venus–mGs (A) and M3R–Rluc8 and NES–venus–mGsq (B) is plotted versus log concentration for the indicated ligands and fitted to a four-parameter logistic equation; mean ± S.E. of four independent experiments. Data points at the far left of these panels represent vehicle controls.
Figure 4.
Figure 4.
Mini G protein subtypes maintain appropriate coupling specificity. A, net BRET to four different NES–venus–mG subtypes is plotted versus log ligand concentration for β2-adrenergic receptors (β2AR–Rluc8), M4 and M3 acetylcholine receptors (M4R-Rluc8 and M3R-Rluc8), and endothelin A receptors (ETA-Rluc8). Ligands are isoproterenol (iso), acetylcholine (Ach), and endothelin-1 (ET-1); mean ± S.E. of 3–4 independent experiments. Data points at the far left of each panel represent vehicle controls. B, heat maps representing normalized maximal BRET (which includes both constitutive and agonist-induced signals, normalized to the best-responding mG protein) for 12 receptors (fused to Rluc8) paired with NES–venus–mG proteins. Heat maps for canonical Gs–, Gi/o–, and Gq–coupled receptors are shown in blue, red, and black, respectively; n = 3–5 independent experiments for each receptor.
Figure 5.
Figure 5.
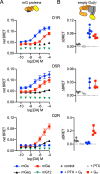
Secondary coupling of Gs–coupled dopamine receptors to mGsi and Gi1 heterotrimers. A, recruitment of mG proteins to dopamine receptors. Net BRET between D1R–, D5R–, or D2R–Nluc and four different NES–venus–mG subtypes in response to dopamine (DA) is shown; mean ± S.E. of 5–7 independent experiments. B, recruitment of empty heterotrimers to dopamine receptors. The difference (ΔBRET) between net BRET observed in the presence of 0.5 mm GDP alone and in the presence of apyrase and dopamine (100 μm) is shown. Cells lacking endogenous Gαs, Gαq, and Gα12 subunits expressed D1R-, D5R-, or D2R-Rluc8 and heterotrimers consisting of Gβγ–venus and the remaining endogenous Gα subunits (control) or overexpressed Gαs or Gαi1. In some experiments cells also expressed the S1 subunit of pertussis toxin (PTX); mean ± S.D. of 3–6 independent experiments.
Figure 6.
Figure 6.
Mini G proteins are recruited to active receptors at the Golgi apparatus. A, confocal images of cells expressing cerulean-tagged A1-adenosine receptors (left) and NES–venus–mGsi before (center) and after (right) stimulation with 100 μm adenosine. Some cells retain significant cerulean–A1R in the Golgi apparatus, and stimulation with adenosine recruits NES–venus–mGsi to this compartment (orange arrowheads) as well as to the plasma membrane (red arrowhead). Scale bar, 10 μm. B, mean NES–venus–mGsi fluorescence (FV, arbitrary units; ± S.E.) at the plasma membrane, Golgi apparatus, and in the cytosol plotted against time for nine cells similar to those shown in A. Accumulation of NES–venus–mGsi at the Golgi apparatus was delayed ∼5 s compared with the plasma membrane. C, BRET between NES–NanoLuc–mGsi and either venus-kras (V-kras) at the plasma membrane or venus-giantin (V-giantin) at the Golgi apparatus (GA) in response to stimulation of unlabeled A1Rs; mean ± S.D. of three independent experiments. D, BRET between NES-Nluc-mGs and the early endosome marker venus-rab5 is plotted versus time after stimulation of unlabeled β2AR with 10 μm isoproterenol; mean ± S.E. of four independent experiments.
Figure 7.
Figure 7.
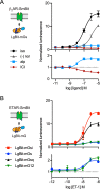
Split luciferase complementation driven by mGs. A, total luminescence (normalized) emitted by cells cotransfected with β2AR-SmBit and LgBit-mGs is plotted versus ligand concentration for isoproterenol (iso), (−)-norepinephrine (nor), alprenolol (alp), and ICI 118,551 (ICI); mean ± S.E. of 4–13 independent experiments. B, total luminescence (normalized) emitted by cells cotransfected with ETAR–SmBit and four different LgBit–mG proteins is plotted versus the concentration of endothelin-1 (ET-1); mean ± S.D. of four independent experiments.

Similar articles

Cited by

References

    1. Pierce K. L., Premont R. T., and Lefkowitz R. J. (2002) Seven-transmembrane receptors. Nat. Rev. Mol. Cell Biol. 3, 639–650 10.1038/nrm908 - DOI - PubMed
    1. Lohse M. J., Nuber S., and Hoffmann C. (2012) Fluorescence/bioluminescence resonance energy transfer techniques to study G-protein-coupled receptor activation and signaling. Pharmacol. Rev. 64, 299–336 10.1124/pr.110.004309 - DOI - PubMed
    1. Barak L. S., Ferguson S. S., Zhang J., and Caron M. G. (1997) A β-arrestin/green fluorescent protein biosensor for detecting G protein-coupled receptor activation. J. Biol. Chem. 272, 27497–27500 10.1074/jbc.272.44.27497 - DOI - PubMed
    1. Galés C., Rebois R. V., Hogue M., Trieu P., Breit A., Hébert T. E., and Bouvier M. (2005) Real-time monitoring of receptor and G-protein interactions in living cells. Nat. Methods 2, 177–184 10.1038/nmeth743 - DOI - PubMed
    1. Hein P., Frank M., Hoffmann C., Lohse M. J., and Bünemann M. (2005) Dynamics of receptor/G protein coupling in living cells. EMBO J. 24, 4106–4114 10.1038/sj.emboj.7600870 - DOI - PMC - PubMed

Publication types