Inhibitor of apoptosis proteins, NAIP, cIAP1 and cIAP2 expression during macrophage differentiation and M1/M2 polarization
- PMID: 29518103
- PMCID: PMC5843221
- DOI: 10.1371/journal.pone.0193643
Inhibitor of apoptosis proteins, NAIP, cIAP1 and cIAP2 expression during macrophage differentiation and M1/M2 polarization
Abstract
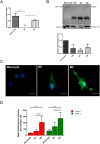
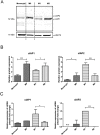
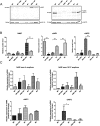
Monocytes and macrophages constitute the first line of defense of the immune system against external pathogens. Macrophages have a highly plastic phenotype depending on environmental conditions; the extremes of this phenotypic spectrum are a pro-inflammatory defensive role (M1 phenotype) and an anti-inflammatory tissue-repair one (M2 phenotype). The Inhibitor of Apoptosis (IAP) proteins have important roles in the regulation of several cellular processes, including innate and adaptive immunity. In this study we have analyzed the differential expression of the IAPs, NAIP, cIAP1 and cIAP2, during macrophage differentiation and polarization into M1 or M2. In polarized THP-1 cells and primary human macrophages, NAIP is abundantly expressed in M2 macrophages, while cIAP1 and cIAP2 show an inverse pattern of expression in polarized macrophages, with elevated expression levels of cIAP1 in M2 and cIAP2 preferentially expressed in M1. Interestingly, treatment with the IAP antagonist SMC-LCL161, induced the upregulation of NAIP in M2, the downregulation of cIAP1 in M1 and M2 and an induction of cIAP2 in M1 macrophages.
Conflict of interest statement
Figures


Similar articles
-
LCL161 increases paclitaxel-induced apoptosis by degrading cIAP1 and cIAP2 in NSCLC.J Exp Clin Cancer Res. 2016 Sep 30;35(1):158. doi: 10.1186/s13046-016-0435-7. J Exp Clin Cancer Res. 2016. PMID: 27737687 Free PMC article.
-
Inhibitor of Apoptosis Protein-1 Regulates Tumor Necrosis Factor-Mediated Destruction of Intestinal Epithelial Cells.Gastroenterology. 2017 Mar;152(4):867-879. doi: 10.1053/j.gastro.2016.11.019. Epub 2016 Nov 24. Gastroenterology. 2017. PMID: 27889570
-
Molecular determinants of Smac mimetic induced degradation of cIAP1 and cIAP2.Cell Death Differ. 2011 Aug;18(8):1376-86. doi: 10.1038/cdd.2011.10. Epub 2011 Feb 18. Cell Death Differ. 2011. PMID: 21331077 Free PMC article.
-
Inhibitors of apoptotic proteins: new targets for anticancer therapy.Chem Biol Drug Des. 2013 Sep;82(3):243-51. doi: 10.1111/cbdd.12176. Chem Biol Drug Des. 2013. PMID: 23790005 Review.
-
Small-molecule SMAC mimetics as new cancer therapeutics.Pharmacol Ther. 2014 Oct;144(1):82-95. doi: 10.1016/j.pharmthera.2014.05.007. Epub 2014 May 16. Pharmacol Ther. 2014. PMID: 24841289 Free PMC article. Review.
Cited by
-
State of the Art on Biomaterials for Soft Tissue Augmentation in the Oral Cavity. Part II: Synthetic Polymers-Based Biomaterials.Polymers (Basel). 2020 Aug 17;12(8):1845. doi: 10.3390/polym12081845. Polymers (Basel). 2020. PMID: 32824577 Free PMC article. Review.
-
mRNA Signatures in Peripheral White Blood Cells Predict Reproductive Potential in Beef Heifers at Weaning.Genes (Basel). 2023 Feb 15;14(2):498. doi: 10.3390/genes14020498. Genes (Basel). 2023. PMID: 36833425 Free PMC article.
-
Comparison of monocytic cell lines U937 and THP-1 as macrophage models for in vitro studies.Biochem Biophys Rep. 2022 Nov 18;32:101383. doi: 10.1016/j.bbrep.2022.101383. eCollection 2022 Dec. Biochem Biophys Rep. 2022. PMID: 36420419 Free PMC article.
-
Effect of Hepatic Macrophage Polarization and Apoptosis on Liver Ischemia and Reperfusion Injury During Liver Transplantation.Front Immunol. 2020 Jun 26;11:1193. doi: 10.3389/fimmu.2020.01193. eCollection 2020. Front Immunol. 2020. PMID: 32676077 Free PMC article. Review.
-
Early Pregnancy Modulates Expression of the Nod-like Receptor Family in Lymph Nodes of Ewes.Animals (Basel). 2022 Nov 25;12(23):3285. doi: 10.3390/ani12233285. Animals (Basel). 2022. PMID: 36496806 Free PMC article.
References
-
- Ginhoux F, Jung S. Monocytes and macrophages: developmental pathways and tissue homeostasis. Nature Reviews Immunology. 2014;14(6):392–404. doi: 10.1038/nri3671 - DOI - PubMed
-
- Gordon S, Taylor PR. Monocyte and macrophage heterogeneity. Nature Reviews Immunology. 2005;5(12):953–964. doi: 10.1038/nri1733 - DOI - PubMed
-
- Italiani P, Boraschi D. From Monocytes to M1/M2 Macrophages: Phenotypical vs. Functional Differentiation. Frontiers in Immunology. 2014;5(OCT):1–22. doi: 10.3389/fimmu.2014.00514 - DOI - PMC - PubMed
-
- Mosser DM, Edwards JP. Exploring the full spectrum of macrophage activation. Nature Reviews Immunology. 2008;8(12):958–969. doi: 10.1038/nri2448 - DOI - PMC - PubMed
-
- Porta C, Rimoldi M, Raes G, Brys L, Ghezzi P, Di Liberto D, et al. Tolerance and M2 (alternative) macrophage polarization are related processes orchestrated by p50 nuclear factor B. Proceedings of the National Academy of Sciences. 2009;106(35):14978–14983. doi: 10.1073/pnas.0809784106 - DOI - PMC - PubMed
Publication types
MeSH terms
Substances
Grants and funding
LinkOut - more resources
Full Text Sources
Other Literature Sources
Molecular Biology Databases
Research Materials
Miscellaneous

