. 2018 May;37(21):2793-2805.
doi: 10.1038/s41388-018-0130-6. Epub 2018 Mar 7.

PARP-1 inhibition with or without ionizing radiation confers reactive oxygen species-mediated cytotoxicity preferentially to cancer cells with mutant TP53

Affiliations

PARP-1 inhibition with or without ionizing radiation confers reactive oxygen species-mediated cytotoxicity preferentially to cancer cells with mutant TP53

Qi Liu et al. Oncogene. 2018 May.

Abstract

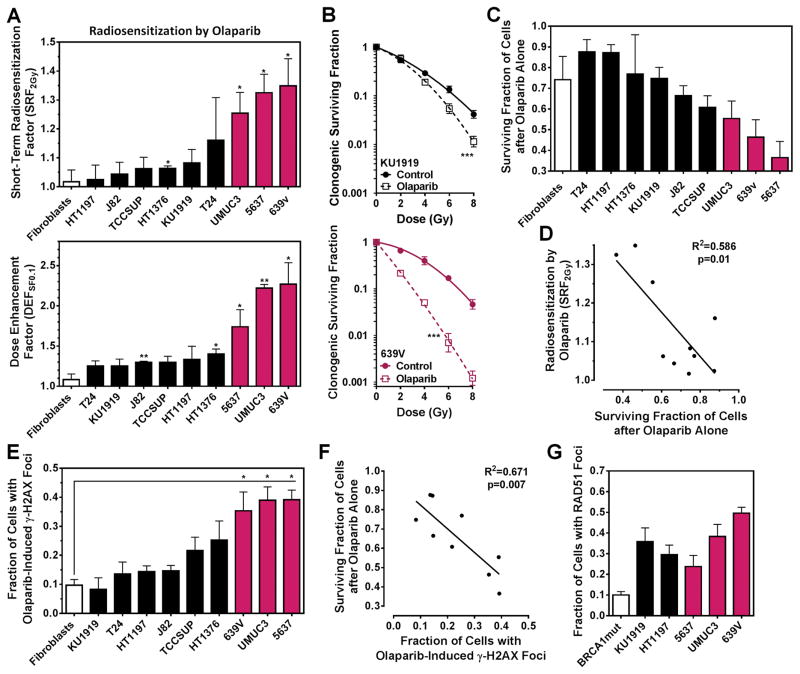
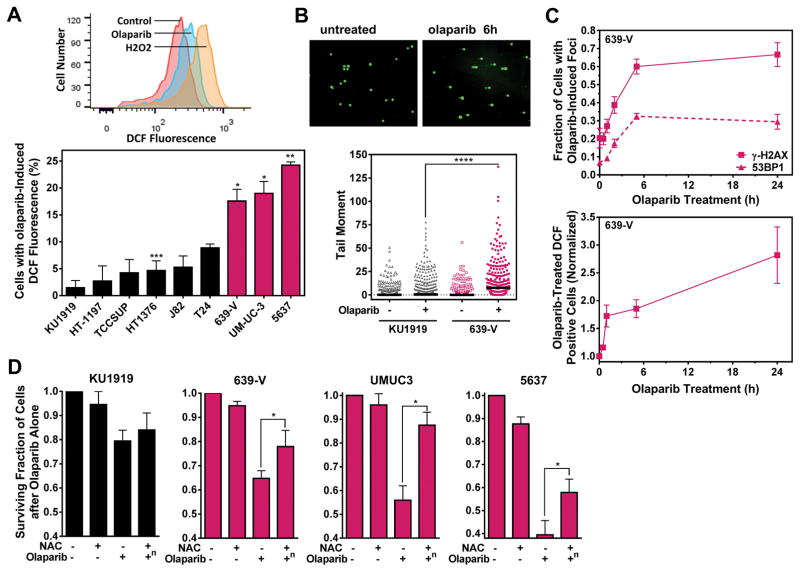
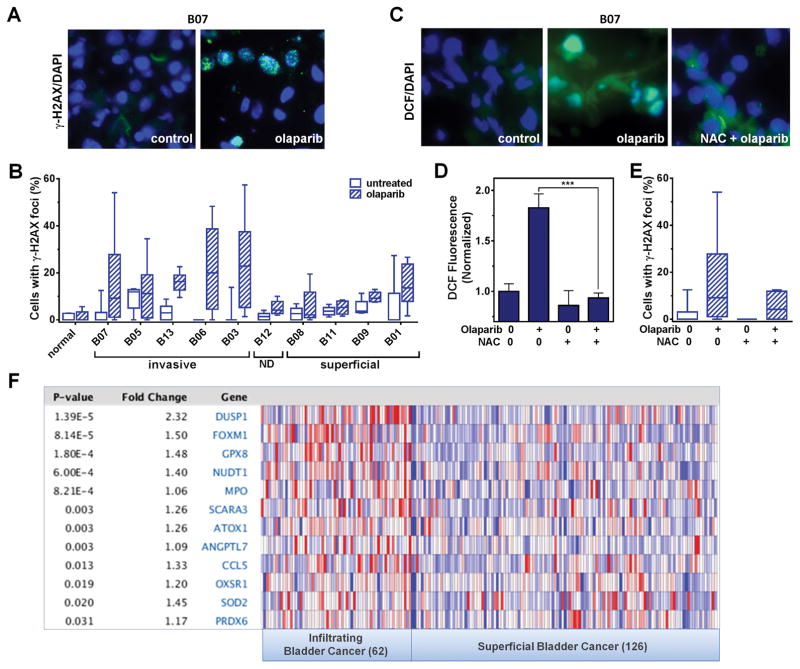
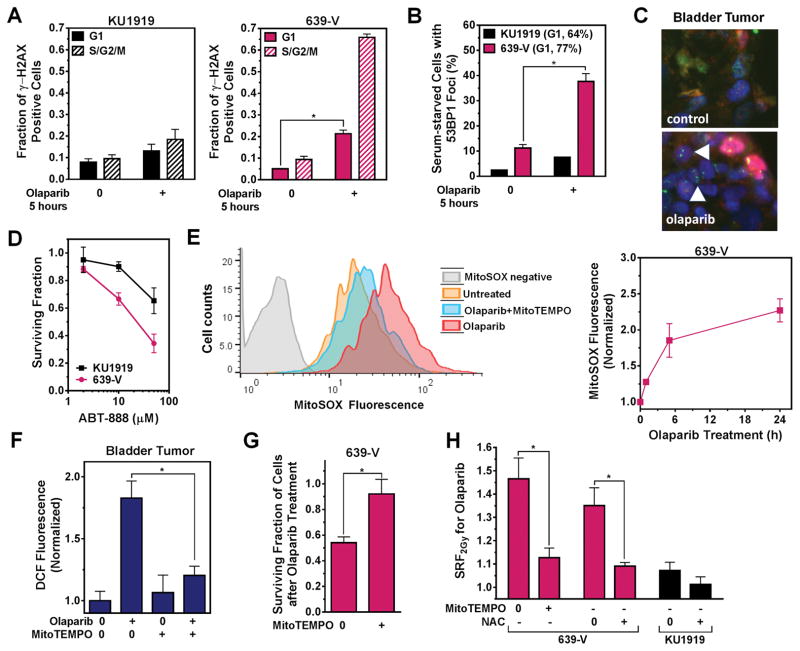
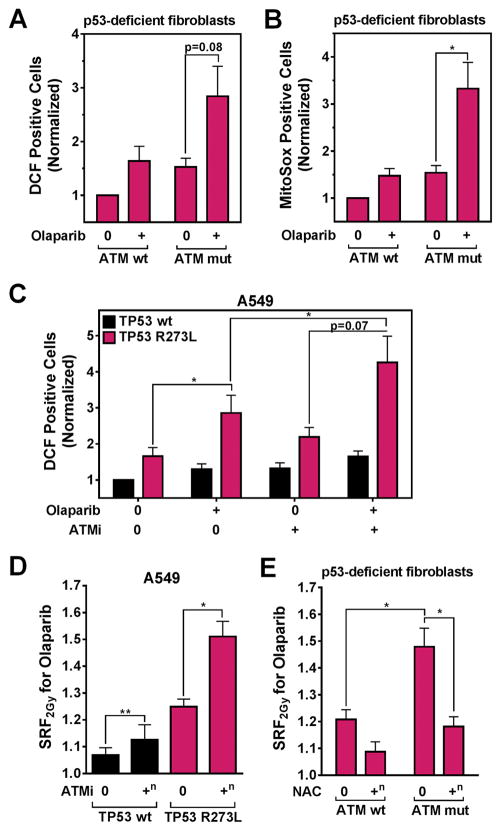
Biomarkers and mechanisms of poly (ADP-ribose) polymerase (PARP) inhibitor-mediated cytotoxicity in tumor cells lacking a BRCA-mutant or BRCA-like phenotype are poorly defined. We sought to explore the utility of PARP-1 inhibitor (PARPi) treatment with/without ionizing radiation in muscle-invasive bladder cancer (MIBC), which has poor therapeutic outcomes. We assessed the DNA damaging and cytotoxic effects of the PARPi olaparib in nine bladder cancer cell lines. Olaparib radiosensitized all cell lines with dose enhancement factors from 1.22 to 2.27. Radiosensitization was correlated with the induction of potentially lethal DNA double-strand breaks (DSB) but not with RAD51 foci formation. The ability of olaparib to radiosensitize MIBC cells was linked to the extent of cell kill achieved with the drug alone. Unexpectedly, increased levels of reactive oxygen species (ROS) resulting from PARPi treatment were the cause of DSB throughout the cell cycle in vitro and in vivo. ROS originated from mitochondria and were required for the radiosensitizing effects of olaparib. Consistent with the role of TP53 in ROS regulation, loss of p53 function enhanced radiosensitization by olaparib in non-isogenic and isogenic cell line models and was associated with increased PARP-1 expression in bladder cancer cell lines and tumors. Impairment of ATM in addition to p53 loss resulted in an even more pronounced radiosensitization. In conclusion, ROS suppression by PARP-1 in MIBC is a potential therapeutic target either for PARPi combined with radiation or drug alone treatment. The TP53 and ATM genes, commonly mutated in MIBC and other cancers, are candidate biomarkers of PARPi-mediated radiosensitization.


Conflict of interest statement

CONFLICT OF INTEREST

The authors disclose no potential conflicts of interest.

Figures

Figure 1
Figure 1. Sensitivity of transitional cell carcinoma (TCC) cell lines to the PARP inhibitor olaparib with or without ionizing radiation (IR) treatment
A. Upper panel, short-term radiosensitization factors (SRF) for 9 TCC cell lines and fibroblast controls (AG01522) treated with 2 Gy and 5 μM olaparib in a plate-based screening format using the CTG assay . Lower panel, dose enhancement factors (DEF) at 0.1 survival fraction derived from full clonogenic survival curves fitted according to the linear-quadratic formalism. B. Illustration of clonogenic survival curves for an olaparib-resistant and -sensitive TCC cell line. C. Fraction of cells after treatment with 5 μM olaparib alone for 5 days using the syto60 assay . D. Correlation of SRF2Gy factors (A, upper) with drug alone toxicity (C). E. Fraction of cells with at least 20 γ-H2AX foci after 24 hours of olaparib treatment. F. Correlation of cell survival after olaparib alone (C) with γ-H2AX positivity (E). G. Fraction of cells with at least 10 RAD51 foci following olaparib alone treatment. BRCA1mut corresponds to HR-deficient control cell line (NCI-H1563). All bars or data points represent means based on at least 3 independent repeat experiments and error bars indicate standard error. Statistical comparisons were made using the student’s T-test (for pair wise comparisons and differences from 1), except for comparisons between survival curves (F-test) and linear regression analyses. *, p≤0.05; **, p≤0.01; ***, p≤0.001.
Figure 2
Figure 2. Involvement of ROS in olaparib-mediated cytotoxicity
A. Upper panel, representative flow cytometry histograms to illustrate the olaparib-induced shift of ROS levels as detected by the DCF probe in 639-V cells. A 1 hour treatment with 100 μM H2O2 was used as a positive control. Lower panel, percentage of cells with high ROS levels following olaparib treatment, correct for endogenous ROS levels in the absence of drug. B. Upper panel, representative images illustrating olaparib-induced comets in 639-V cells following 5 hours (h) of drug treatment. Lower panel, quantification of alkaline Comet assay with tail moment plotted against treatments as indicated. Scatter plots show individual data points from 3 independent repeat experiments, with horizontal lines indicating median values. C. Upper panel, DSB kinetics using γ-H2AX and 53BP1 foci formation in olaparib-treated 639-V cells with readouts normalized to untreated controls. Lower panel, parallel determination of ROS formation. D. Fraction of cells after treatment with the anti-oxidant N-acetyl cysteine (NAC) or olaparib was determined by the syto60 assay. The combined drug effect was corrected for the effect of NAC alone as indicated by “n”. NAC was added to cells every 24 hours at 0.5 mM (KU1919, 639-V) or 0.2 mM (5637, UMUC3). For data presentation and statistical comparisons see Fig. 1, except in Fig. 2B statistical comparison was performed using the Mann-Whitney test.
Figure 3
Figure 3. Olaparib effects and ROS in human bladder tumors
A. Representative images demonstrating γ-H2AX foci induction in a MIBC explant. Blue, nuclear DAPI stain. B. Percentage of cells with at least two γ-H2AX foci following ex-vivo treatment of tissue explants with 10 μM olaparib for 24 hours. Tissues were grouped as normal (normal bladder wall), muscle-invasive carcinoma, superficial carcinoma, and other carcinoma (not defined, ND). Data are displayed in a box-and-whiskers plot, which shows the median value, quartiles, and the range of the data points. C. Illustration of cell-based analysis of DCF fluorescence in a representative MIBC explant exposed to olaparib (10 μM) or/and NAC (1 mM) for 24 hours. D. Quantification of DCF fluorescence signal with treatments as indicated. E. Percentage of cells with at least two γ-H2AX foci in the same tumor as a function of ex-vivo drug treatment as indicated. F. Expression pattern of genes involved in the cellular response to oxidative stress in superficial (n=62) versus muscle-invasive bladder cancers (n=126) .
Figure 4
Figure 4. Effect of ROS on DNA damage and radiosensitization
A. Fraction of cells with high γ-H2AX fluorescence after 5 hours (h) of treatment of olaparib. Fixed cells were co-stained with γ-H2AX and propidium iodide and analyzed by flow cytometry. Cells were divided into G1 phase or S/G2/M phase subgroups for quantifying γ-H2AX fluorescence. B. Percentage of cells with at least 20 53BP1 foci following 48 h of serum starvation +/− 5h olaparib, which led to an enrichment of the cell population with G1 phase cells. C. Representative images showing olaparib-induced 53BP1foci (green) in PCNA (red) negative cells in a MIBC explant. Arrows point to PCNA-negative cells harboring DSB, presumed to be in G0 or G1 phase. D. Sensitivity of 639-V and KU-19-19 cells to the catalytic non-trapping PARP inhibitor ABT-888 as measured by a 6-day cell proliferation assay (syto60). E. Left panel, Representative flow cytometry image showing MitoSOX fluorescence in 639-V cells under different conditions. Right panel, Kinetics of mitochondrial ROS as measured with the MitoSOX probe. F. Effect of a mitochondrial ROS scavenger (MitoTEMPO, 1 μM) on olaparib-induced ROS production in a MIBC explant analogous to Fig. 3D. G. Cell survival fraction of olaparib-treated 639-V cells with or without MitoTEMPO as measured by the syto60 assay. H. Radiosensitization factors (SRF2Gy) for representative olaparib-treated bladder cancer cell lines with or without MitoTEMPO or NAC co-incubation. For data presentation and statistical comparisons see Fig. 1.
Figure 5
Figure 5. Role of TP53 status for olaparib-mediated ROS levels and cytoxicity
A. Correlation of radiosensitzing effect by olaparib (DEF, dose enhancement factor) and curated TP53 mutation status (cancerrxgene.org/translation/CellLine, p53.free.fr). B. DEFSF0.1 radiosensitization values for TCC cell lines with versus without mutations in the TP53 core domain. C. SRF2Gy radiosensitization values for TCC cell lines (left panel) compared to cell lines from other cancer types (right panel). D. Comparison of SRF2Gy values in isogenic cell pairs with variable TP53 status. wt, wild-type; R273L, mutant transgene; E6, HPV16 E6 infected; −/−, allelic knock-out. E. Fractions of A549 and MCF-7 cells treated with olaparib at the concentrations indicated for 5 days as measured by syto60 assay. F. Fraction of A549 cells following the treatments as indicated. The combined drug effect was corrected for the effect of NAC alone as indicated by “n”. G. SRF2Gy values for the treatments indicated are shown. H. Percentage of A549 cells with DCF fluorescence analogously to Fig. 2A. I. Whole cell lysates from the isogenic A549 pair and six TCC cell lines were subjected to Western blot for expression of PARP-1. J. Left panel, PARP1 protein bands from panel I were quantified with ImageJ and normalized to their corresponding β-actin expression values. Right panel, log-transformed PARP1 expression in a cohort of 74 patients with bladder cancer according to TP53 status . For data presentation and statistical analysis, see Fig. 1, except for panel J for which the Mann-Whitney test was used.
Figure 6
Figure 6. Role of ATM function for olaparib-mediated ROS levels and cytotoxicity
A. Normalized DCF fluorescence of SV40-transformed human fibroblasts with non-functional p53 and either wild-type (wt, NF) or bi-allelic mutant (mut, AT5BIVA) for ATM, analogous to Fig. 2B B. Normalized MitoSOX fluorescence analogous to Fig. 4E. C. Normalized DCF fluorescence in isogenic A549 cell lines after treatments as indicated. ATMi, ATM inhibitor KU55933 used at 0.5 μM. D. SRF2Gy radiosensitization values derived from the treatment of A549 tumor spheres . Combined drug effects were corrected for the cytotoxicity seen with KU55933 alone. E. SRF2Gy values derived from the treatment of SV40-transformed human fibroblasts with different ATM status. For data presentation and statistical analysis, see Fig. 1.

Similar articles

Cited by

References

    1. Ameziane-El-Hassani R, Dupuy C. Detection of Intracellular Reactive Oxygen Species (CM-H2DCFDA) Bio-protocol. 2013;3:e313.
    1. Audebert M, Salles B, Calsou P. Involvement of poly(ADP-ribose) polymerase-1 and XRCC1/DNA ligase III in an alternative route for DNA double-strand breaks rejoining. J Biol Chem. 2004;279:55117–55126. - PubMed
    1. Bai P, Canto C, Oudart H, Brunyanszki A, Cen Y, Thomas C, et al. PARP-1 inhibition increases mitochondrial metabolism through SIRT1 activation. Cell Metab. 2011;13:461–468. - PMC - PubMed
    1. Birkelbach M, Ferraiolo N, Gheorghiu L, Pfäffle HN, Daly B, Ebright M, et al. Detection of Impaired Homologous Recombination Repair in NSCLC Cells and Tissues. J Thorac Oncol. 2013;8:279–286. - PMC - PubMed
    1. Brenner JC, Ateeq B, Li Y, Yocum AK, Cao Q, Asangani IA, et al. Mechanistic rationale for inhibition of poly(ADP-ribose) polymerase in ETS gene fusion-positive prostate cancer. Cancer Cell. 2011;19:664–678. - PMC - PubMed

Publication types

MeSH terms