. 2018 Apr;21(4):541-551.
doi: 10.1038/s41593-018-0100-x. Epub 2018 Mar 5.

Single-cell mass cytometry reveals distinct populations of brain myeloid cells in mouse neuroinflammation and neurodegeneration models

Affiliations

Single-cell mass cytometry reveals distinct populations of brain myeloid cells in mouse neuroinflammation and neurodegeneration models

Bahareh Ajami et al. Nat Neurosci. 2018 Apr.

Abstract

Neuroinflammation and neurodegeneration may represent two poles of brain pathology. Brain myeloid cells, particularly microglia, play key roles in these conditions. We employed single-cell mass cytometry (CyTOF) to compare myeloid cell populations in the experimental autoimmune encephalomyelitis (EAE) model of multiple sclerosis, the R6/2 model of Huntington's disease (HD) and the mutant superoxide dismutase 1 (mSOD1) model of amyotrophic lateral sclerosis (ALS). We identified three myeloid cell populations exclusive to the CNS and present in each disease model. Blood-derived monocytes comprised five populations and migrated to the brain in EAE, but not in HD and ALS models. Single-cell analysis resolved differences in signaling and cytokine production within similar myeloid populations in EAE compared to HD and ALS models. Moreover, these analyses highlighted α5 integrin on myeloid cells as a potential therapeutic target for neuroinflammation. Together, these findings illustrate how neuropathology may differ between inflammatory and degenerative brain disease.


Conflict of interest statement

Competing interests:

The authors declare no competing financial interest.

Figures

Figure 1:
Figure 1:. Schematic representation of the experimental strategy.
Immune response profiles were analyzed in Healthy, five different clinical stages of EAE, and end-stage HD. Single-cell suspensions from CNS and whole blood of each condition were prepared as described in Methods. Individual samples were simultaneously processed by using the barcoding strategy (Methods). Barcoded samples were pooled, stained with a panel of 39 antibodies (Supplementary Table 2a–c and Methods), and analyzed by mass cytometry. Raw mass cytometry data were normalized for signal variation over time and debarcoded and analyzed using the X-shift algorithm, a nonparametric clustering method that automatically identifies cell populations by searching for local maxima of cell event density in the multidimensional marker space. The result is displayed as a MST layout. In each experiment, tissues from ten mice were pooled in order to provide enough cell number (Methods). Each experiment was performed seven to ten times independently.
Figure 2:
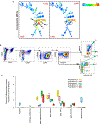
Figure 2:. Data-driven, unsupervised clustering defines three distinct CNS-resident myeloid populations.
a) Composite CNS MST of X-shift clusters constructed by combining CNS samples from all the conditions and their biological replicates (n=37) in comparison to composite MST from peripheral blood samples (n=37) reveals three myeloid (CD11b+) populations that are unique to CNS (Populations A, B and C). All samples were barcoded and analyzed together on CyTOF. The color code shows the expression level of CD11b. b) Manual gating based on markers and threshold defined by the X-shift/DMT algorithm confirmed the existence of populations A, B and C. Live cells are identified by the lack of cleaved poly-(ADP)-ribose polymerase (c-PARP) binding (Supplementary Fig. 13b, Methods). This panel represents data from Peak EAE, where 7 independent experiments confirmed a similar gate. c) Visualization of clusters under different clinical conditions demonstrates that populations A, B and C are present in both EAE and HD models. The color code shows the expression level of CD11b (n=5). d) Frequency of populations A, B and C based on manual gating confirms that populations A, B and C are present in both EAE and HD models. Center line is average; boxes extend to 25th and 75th percentile; whiskers extend to 5th and 95th percentiles. (n= 5 independent experiments for healthy, end-stage HD, presymptomatic EAE, Chronic EAE; n=6 independent experiments for Onset EAE, Peak EAE).
Figure 3:
Figure 3:. CyTOF analysis reveals the signaling and cytokine molecular signatures in the three CNS-resident myeloid populations under different clinical conditions.
a-d) Dynamic of key signaling molecules of immune activation pathways in the three CNS-resident myeloid populations. Box-and-whisker plots show median raw CyTOF signal intensity per population. The grey area represents the interquartile range of the given signaling molecule in all cells in a sample, averaged across replicates, and thus indicates the overall expression range for each marker. Center line is average; boxes extend to 25th and 75th percentile; whiskers extend to 5th and 95th percentiles. (n= 5 independent experiments for healthy, end-stage HD, presymptomatic EAE, Chronic EAE; n=6 independent experiments for Onset EAE, Peak EAE). (e-g) Single-cell analysis of cytokine production by the three CNS-resident myeloid populations in response to different disease conditions. Analysis of cytokine co-expression in CNS-resident myeloid populations in healthy and diseased states demonstrating heterogeneous subsets in each population. Percentages of single-cells expressing zero, one or two cytokines are represented in a stacked bar graph (n=3 independent experiments).
Figure 4:
Figure 4:. Kinetics of Peripheral Monocytes in CNS under Inflammatory versus Degenerative conditions
a) Composite MSTs of CNS samples (n=37) reveals five distinct Ly6C+Ly6G- myeloid populations (peripheral monocytes) in CNS. The color code shows the expression levels of Ly6C and Ly6G. b) Manual gating based on markers and threshold defined by the X-shift/DMT algorithm confirmed each population. This panel represents data from Peak EAE, where 7 independent experiments confirmed a similar gate. c) Frequency analysis based on manual gating demonstrates that there is a minimum accumulation of peripheral monocytes in healthy and neurodegenerative conditions. In EAE disease, different peripheral monocyte populations accumulated depending on the disease state. Center line is average; boxes extend to 25th and 75th percentile; whiskers extend to 5th and 95th percentiles. (n= 5 independent experiments for healthy, end-stage HD, presymptomatic EAE, Chronic EAE; n=6 independent experiments for Onset EAE, Peak EAE).
Figure 5:
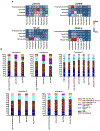
Figure 5:. Single-cell analysis of signaling molecules and cytokine production in different peripheral monocyte populations in response to different disease conditions.
a) Heat map representing the comparison of median raw CyTOF signal intensity for each signaling molecule between CNS-resident myeloid populations and peripheral monocyte populations in presymptomatic, onset and peak EAE when all five peripheral monocyte populations are present. The color representing the signaling molecule expression ranges from blue (undetectable) to white (intermediate) to red (maximum). Mass cytometry data are from five or six independent experiments (n= 5 independent experiments for healthy, end-stage HD, presymptomatic EAE, Chronic EAE; n=6 independent experiments for Onset EAE, Peak EAE). ND = not distinguishable. b) Single-cell analysis of cytokine production by different peripheral monocyte populations in response to different disease conditions. X-shift analysis of the co-expression of cytokines in peripheral monocyte populations suggests that each population contains heterogeneous subsets depending on each disease conditions. Percentages of single-cells expressing zero, one, two, three or four cytokines are represented in a stacked bar graph (n=3 independent experiments).
Figure 6:
Figure 6:. CyTOF analysis reveals a therapeutic target on Infiltrating myeloid Cells in inflammatory condition.
a) Cell Surface Phenotype analysis reveals high expression of CD49d (α4 integrin) and CD49e (α5 integrin) only on infiltrating myeloid cells compared to CNS-resident myeloid cells. CD49e is only expressed on myeloid cells whereas CD49d is also expressed on T cells and DCs. b) Average clinical score for EAE mice treated daily with an anti-CD49e antibody compared to an isotype control antibody. In this prophylactic regimen, treatment started at the time of EAE induction. Mice treated with anti-CD49e antibody exhibit a delay in disease onset and have significantly reduced overall disease severity. The experiment was concluded due to the high morbidity of control mice. Arrow indicates when the treatment was started. Each point represents the mean clinical disease score ± SEM. Each asterisk (*) represents a p-value < 0.05 by Mann-Whitney one-tailed test comparing between the two groups (n = 5 mice). c) Average clinical score for EAE mice treated daily with anti-CD49e antibody compared to an isotype control starting when EAE disease is established. Mice treated with anti-CD49e antibody exhibit reduced overall disease severity. Arrow indicates when the treatment has started. Each point represents the mean ± SEM. Each asterisk (*) represents a p-value < 0.05 by Mann-Whitney one-tailed test comparing between the two groups (n = 10 mice). d and e) CyTOF analysis from CNS tissue of EAE mice treated with either isotype control antibody or anti-CD49e antibody (graph C experiment).

Similar articles

Cited by

References

    1. Prinz M & Priller J The role of peripheral immune cells in the CNS in steady state and disease. Nat Neurosci 20, 136–144, doi:10.1038/nn.4475 (2017). - DOI - PubMed
    1. Steinman L Immunology of relapse and remission in multiple sclerosis. Annu Rev Immunol 32, 257–281, doi:10.1146/annurev-immunol-032713-120227 (2014). - DOI - PubMed
    1. Heppner FL, Ransohoff RM & Becher B Immune attack: the role of inflammation in Alzheimer disease. Nat Rev Neurosci 16, 358–372, doi:10.1038/nrn3880 (2015). - DOI - PubMed
    1. McGeer PL, Itagaki S, Boyes BE & McGeer EG Reactive microglia are positive for HLA-DR in the substantia nigra of Parkinson’s and Alzheimer’s disease brains. Neurology 38, 1285–1291 (1988). - PubMed
    1. Crotti A et al. Mutant Huntingtin promotes autonomous microglia activation via myeloid lineage-determining factors. Nat Neurosci 17, 513–521, doi:10.1038/nn.3668 (2014). - DOI - PMC - PubMed

Methods-only references

    1. Linthicum DS, Munoz JJ & Blaskett A Acute experimental autoimmune encephalomyelitis in mice. I. Adjuvant action of Bordetella pertussis is due to vasoactive amine sensitization and increased vascular permeability of the central nervous system. Cell Immunol 73, 299–310 (1982). - PubMed
    1. Hofstetter HH, Shive CL & Forsthuber TG Pertussis toxin modulates the immune response to neuroantigens injected in incomplete Freund’s adjuvant: induction of Th1 cells and experimental autoimmune encephalomyelitis in the presence of high frequencies of Th2 cells. J Immunol 169, 117–125 (2002). - PubMed
    1. Hou W et al. Pertussis toxin enhances Th1 responses by stimulation of dendritic cells. J Immunol 170, 1728–1736 (2003). - PubMed
    1. Chen X et al. Pertussis toxin as an adjuvant suppresses the number and function of CD4+CD25+ T regulatory cells. Eur J Immunol 36, 671–680, doi:10.1002/eji.200535353 (2006). - DOI - PMC - PubMed
    1. Weber MS et al. Repetitive pertussis toxin promotes development of regulatory T cells and prevents central nervous system autoimmune disease. PLoS One 5, e16009, doi:10.1371/journal.pone.0016009 (2010). - DOI - PMC - PubMed

Publication types

MeSH terms