Imbalance of gut microbiome and intestinal epithelial barrier dysfunction in patients with high blood pressure
- PMID: 29507058
- PMCID: PMC5955695
- DOI: 10.1042/CS20180087
Imbalance of gut microbiome and intestinal epithelial barrier dysfunction in patients with high blood pressure
Abstract
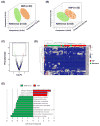
Recent evidence indicates a link between gut pathology and microbiome with hypertension (HTN) in animal models. However, whether this association exists in humans is unknown. Thus, our objectives in the present study were to test the hypotheses that high blood pressure (BP) patients have distinct gut microbiomes and that gut-epithelial barrier function markers and microbiome composition could predict systolic BP (SBP). Fecal samples, analyzed by shotgun metagenomics, displayed taxonomic and functional changes, including altered butyrate production between patients with high BP and reference subjects. Significant increases in plasma of intestinal fatty acid binding protein (I-FABP), lipopolysaccharide (LPS), and augmented gut-targetting proinflammatory T helper 17 (Th17) cells in high BP patients demonstrated increased intestinal inflammation and permeability. Zonulin, a gut epithelial tight junction protein regulator, was markedly elevated, further supporting gut barrier dysfunction in high BP. Zonulin strongly correlated with SBP (R2 = 0.5301, P<0.0001). Two models predicting SBP were built using stepwise linear regression analysis of microbiome data and circulating markers of gut health, and validated in a separate cohort by prediction of SBP from zonulin in plasma (R2 = 0.4608, P<0.0001). The mouse model of HTN, chronic angiotensin II (Ang II) infusion, was used to confirm the effects of butyrate and gut barrier function on the cardiovascular system and BP. These results support our conclusion that intestinal barrier dysfunction and microbiome function are linked to HTN in humans. They suggest that manipulation of gut microbiome and its barrier functions could be the new therapeutic and diagnostic avenues for HTN.
Keywords: Butyrate; High blood pressure; Hypertension; Microbiome; Zonulin; gastrointestinal physiology.
© 2018 The Author(s). Published by Portland Press Limited on behalf of the Biochemical Society.
Conflict of interest statement
The authors declare that there are no competing interests associated with the manuscript.
Figures


Comment in
-
Imbalance of gut microbiome and intestinal epithelial barrier dysfunction in cardiovascular disease.Clin Sci (Lond). 2018 Apr 30;132(8):901-904. doi: 10.1042/CS20180172. Print 2018 Apr 30. Clin Sci (Lond). 2018. PMID: 29712884
Similar articles
-
Dysbiosis and zonulin upregulation alter gut epithelial and vascular barriers in patients with ankylosing spondylitis.Ann Rheum Dis. 2017 Jun;76(6):1123-1132. doi: 10.1136/annrheumdis-2016-210000. Epub 2017 Jan 9. Ann Rheum Dis. 2017. PMID: 28069576 Free PMC article.
-
Changes in intestinal permeability and gut microbiota following diet-induced weight loss in patients with metabolic dysfunction-associated steatohepatitis and liver fibrosis.Gut Microbes. 2024 Jan-Dec;16(1):2392864. doi: 10.1080/19490976.2024.2392864. Epub 2024 Sep 28. Gut Microbes. 2024. PMID: 39340210 Free PMC article.
-
Exploiting the Zonulin Mouse Model to Establish the Role of Primary Impaired Gut Barrier Function on Microbiota Composition and Immune Profiles.Front Immunol. 2019 Sep 19;10:2233. doi: 10.3389/fimmu.2019.02233. eCollection 2019. Front Immunol. 2019. PMID: 31608059 Free PMC article.
-
The Role and Mechanism of Intestinal Flora in Blood Pressure Regulation and Hypertension Development.Antioxid Redox Signal. 2021 Apr 1;34(10):811-830. doi: 10.1089/ars.2020.8104. Epub 2020 May 14. Antioxid Redox Signal. 2021. PMID: 32316741 Review.
-
Microbiota and Hypertension: Role of the Sympathetic Nervous System and the Immune System.Am J Hypertens. 2020 Oct 21;33(10):890-901. doi: 10.1093/ajh/hpaa103. Am J Hypertens. 2020. PMID: 32614942 Review.
Cited by
-
Restraint Stress in Hypertensive Rats Activates the Intestinal Macrophages and Reduces Intestinal Barrier Accompanied by Intestinal Flora Dysbiosis.J Inflamm Res. 2021 Mar 25;14:1085-1110. doi: 10.2147/JIR.S294630. eCollection 2021. J Inflamm Res. 2021. PMID: 33790622 Free PMC article.
-
Effects of Losartan, Atorvastatin, and Aspirin on Blood Pressure and Gut Microbiota in Spontaneously Hypertensive Rats.Molecules. 2023 Jan 6;28(2):612. doi: 10.3390/molecules28020612. Molecules. 2023. PMID: 36677668 Free PMC article.
-
The etiology of preeclampsia.Am J Obstet Gynecol. 2022 Feb;226(2S):S844-S866. doi: 10.1016/j.ajog.2021.11.1356. Am J Obstet Gynecol. 2022. PMID: 35177222 Free PMC article. Review.
-
Postnatal exposure to ambient air pollutants is associated with the composition of the infant gut microbiota at 6-months of age.Gut Microbes. 2022 Jan-Dec;14(1):2105096. doi: 10.1080/19490976.2022.2105096. Gut Microbes. 2022. PMID: 35968805 Free PMC article.
-
Regulatory effect of gut microbes on blood pressure.Animal Model Exp Med. 2022 Dec;5(6):513-531. doi: 10.1002/ame2.12233. Epub 2022 Jul 26. Animal Model Exp Med. 2022. PMID: 35880388 Free PMC article. Review.
References
-
- Benjamin EJ, Blaha MJ, Chiuve SE, Cushman M, Das SR, Deo R, et al. Heart Disease and Stroke Statistics-2017 update: a report from the American Heart Association. Circulation. 2017;135:e146–e603. https://doi.org/10.1161/CIR.0000000000000485. - DOI - PMC - PubMed
-
- Okin PM, Kjeldsen SE, Devereux RB. The relationship of all-cause mortality to average on-treatment systolic blood pressure is significantly related to baseline systolic blood pressure: implications for interpretation of the Systolic Blood Pressure Intervention Trial study. J Hypertens. 2017 https://doi.org/10.1097/HJH.0000000000001620. - DOI - PubMed
-
- Materson BJ, Reda DJ, Cushman WC, Massie BM, Freis ED, Kochar MS, et al. Single-drug therapy for hypertension in men. A comparison of six antihypertensive agents with placebo The Department of Veterans Affairs Cooperative Study Group on Antihypertensive Agents. N Engl J Med. 1993;328:914–921. https://doi.org/10.1056/NEJM199304013281303. - DOI - PubMed
-
- Page IH. The mosaic theory of arterial hypertension–its interpretation. Perspect Biol Med. 1967;10:325–333. https://doi.org/10.1353/pbm.1967.0031. - DOI - PubMed
-
- Raizada MK, Joe B, Bryan NS, Chang EB, Dewhirst FE, Borisy GG, et al. Report of the National Heart, Lung, and Blood Institute Working Group on the role of microbiota in blood pressure regulation: current status and future directions. Hypertension. 2017 https://doi.org/10.1161/HYPERTENSIONAHA.117.09699. - DOI - PMC - PubMed
Publication types
MeSH terms
Substances
Grants and funding
LinkOut - more resources
Full Text Sources
Other Literature Sources
Medical
Research Materials
Miscellaneous

