. 2018 May;22(5):2908-2921.
doi: 10.1111/jcmm.13585. Epub 2018 Mar 5.

TAK1 mediates excessive autophagy via p38 and ERK in cisplatin-induced acute kidney injury

Affiliations

TAK1 mediates excessive autophagy via p38 and ERK in cisplatin-induced acute kidney injury

Jun Zhou et al. J Cell Mol Med. 2018 May.

Abstract

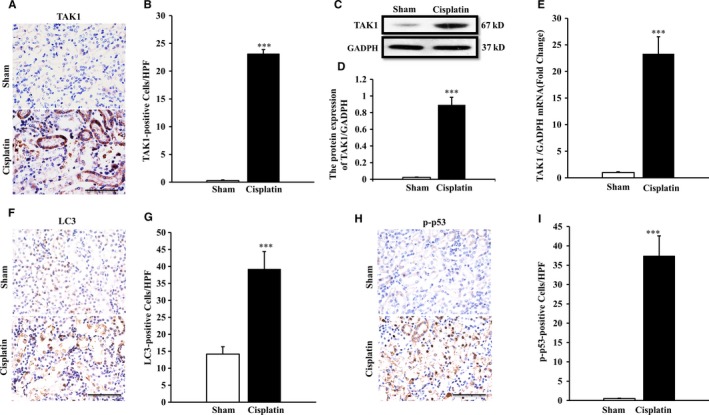
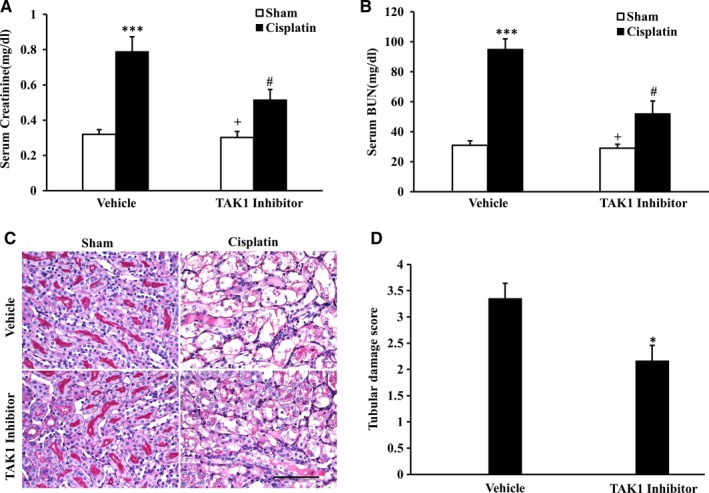
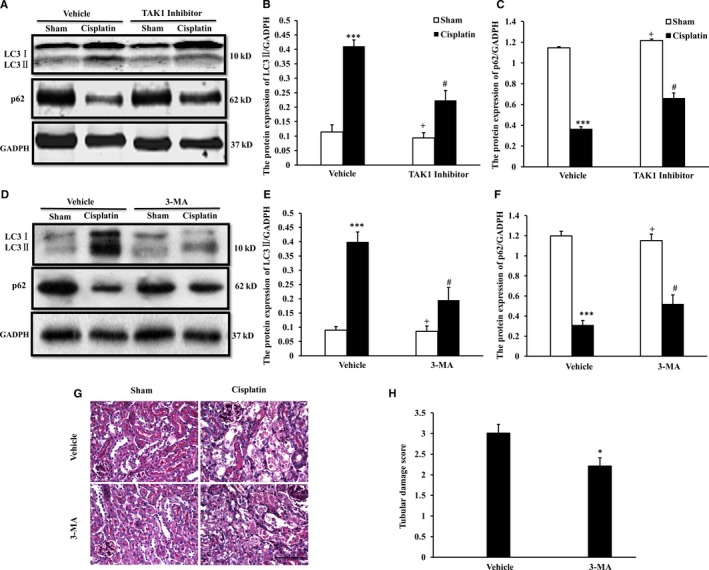
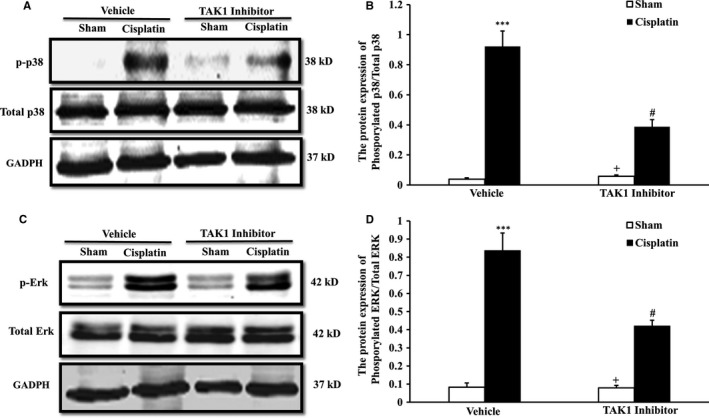
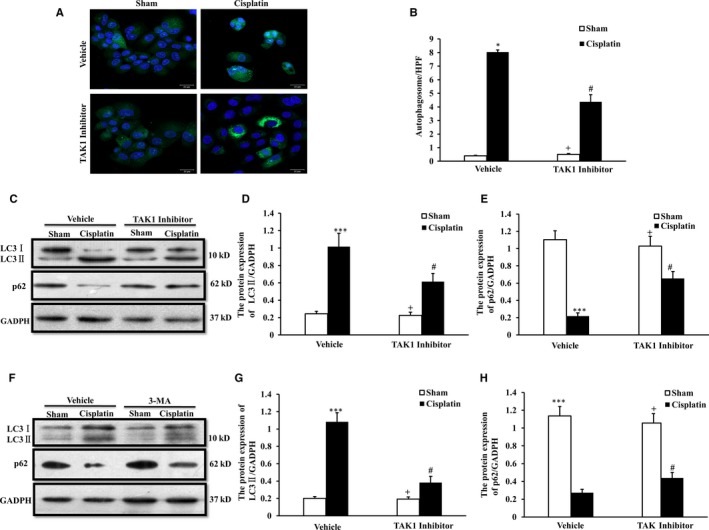
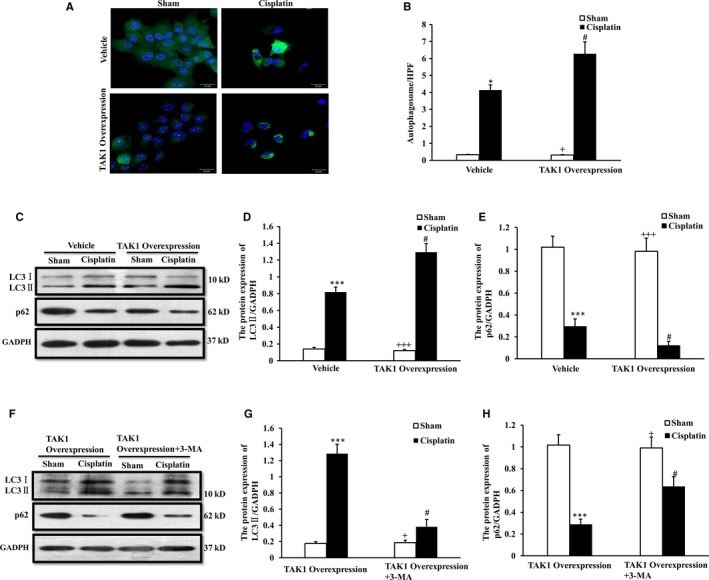
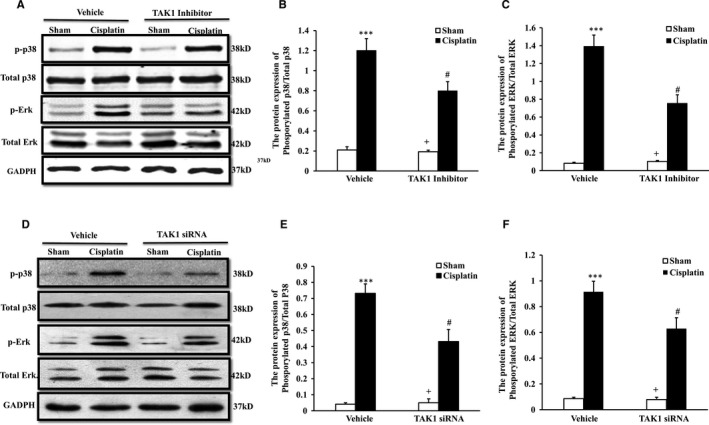
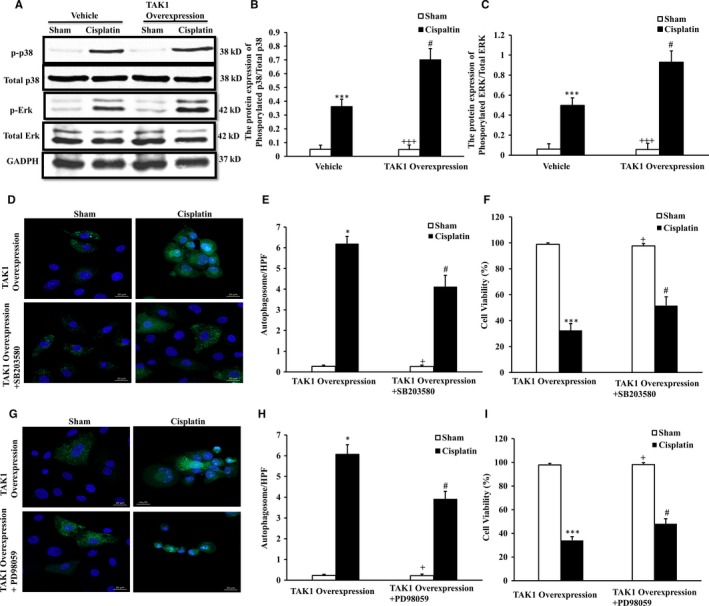
The ability of cisplatin (cis-diamminedichloroplatinum II) toxicity to induce acute kidney injury (AKI) has attracted people's attention and concern for a long time, but its molecular mechanisms are still widely unknown. We found that the expression of transforming growth factor-β (TGF-β)-activated kinase 1 (TAK1) could be increased in kidneys of mice administrated with cisplatin. Autophagy is an evolutionarily conserved catabolic pathway and is involved in various acute and chronic injuries. Moreover, p38 MAPK (mitogen-activated protein kinase) and ERK regulate autophagy in response to various stimuli. Therefore, our hypothesis is that cisplatin activates TAK1, which phosphorylates p38 and ERK, leading to excessive autophagy of tubular epithelial cells and thus exacerbating kidney damage. Here, BALB/c mice were intraperitoneally injected with a TAK1 inhibitor and were then administrated with sham or cisplatin at 20 mg/kg by intraperitoneal injection. Compared with mice in the vehicle cisplatin group, mice intraperitoneally injected with a TAK1 inhibitor were found to have lower serum creatinine and less tubular damage following cisplatin-induced AKI. Furthermore, inhibition of TAK1 reduced p38 and Erk phosphorylation, decreased expression of LC3II and reversed the down-regulation of P62 expression induced by cisplatin. The hypothesis was verified with tubular epithelial cells administrated with cisplatin in vitro. Finally, p38 inhibitor or ERK inhibitor abated autophagy activation and cell viability reduction in tubular epithelial cells treated with cisplatin plus TAK1 overexpression vector. Taken together, our results show that cisplatin activates TAK1, which phosphorylates p38 and ERK, leading to excessive autophagy of tubular epithelial cells that exacerbates kidney damage.

Keywords: ERK; TAK1; acute kidney injury; autophagy; p38.


Figures

Figure 1
Figure 1
TAK1 expression in kidneys of mice with cisplatin‐induced AKI. A, Representative photomicrographs of TAK1 immunohistochemical staining in kidneys of mice i.p. with cisplatin (20 mg/kg) or saline (Original magnification: ×400, Scale bar:50 μm). B, Quantitative analysis of TAK1‐positive cells in kidneys of mice i.p. with cisplatin (20 mg/kg) or saline. ***P < .001 vs Sham, n = 6 each. C, Representative Western blots show TAK1 protein expression in kidneys of mice after sham or cisplatin treatment. D, Quantitative analysis of protein expression of TAK1 in kidneys of mice. ***P < .001 vs Sham, n = 6 in each group. E, Quantitative analysis of TAK1 mRNA in kidneys of mice. ***P < .001 vs Sham, n = 6 in each group. F, Representative photomicrographs of LC3 immunohistochemical staining in kidneys of mice i.p. with cisplatin (20 mg/kg) or saline (Original magnification: ×400, Scale bar: 50 μm). G, Quantitative analysis of LC3‐positive cells in kidneys of mice. ***P < .001 vs Sham, n = 6 each. H, Representative photomicrographs of p‐p53 immunohistochemical staining in kidneys of mice i.p. with cisplatin (20 mg/kg) or saline (Original magnification: ×400, Scale bar:50 μm). I, Quantitative analysis of p‐p53‐positive cells in kidneys of mice. ***P < .001 vs Sham, n = 6 each
Figure 2
Figure 2
Inhibition of TAK1 protects kidney against cisplatin‐induced AKI. A, Effect of TAK1 inhibition on serum creatinine in vehicle group and TAK1 inhibitor group mice at 72 h after cisplatin or saline treatment. ***P < .001 vs Sham Vehicle; + P < .05 vs TAK1 inhibitor Cisplatin; # P < .05 vs Vehicle Cisplatin. n = 6 in each group. B, Effect of TAK1 inhibition on serum urea nitrogen in Vehicle group and TAK1 inhibitor group mice at 72 h after cisplatin or saline treatment. ***P < .001 vs Sham Vehicle; + P < .05 vs TAK1 inhibitor Cisplatin; # P < .05 vs Vehicle Cisplatin. n = 6 in each group. C, PAS staining for kidney sections of vehicle group and TAK1 inhibitor group mice at 72 h after cisplatin or saline treatment (Original magnification: ×400, Scale bar:50 μm). D, Quantitative assessment of tubular damage in mice at 72 h after cisplatin treatment. *P < .05 vs Vehicle Cisplatin. n = 6 in each group
Figure 3
Figure 3
Inhibition of TAK1 decreased autophagy of tubular epithelial cells in cisplatin‐induced AKI. A, Representative Western blots show LC3 I/II and p62 protein expression in kidneys of vehicle group and TAK1 inhibitor group mice (5Z‐7‐oxozeaenol, 4 mg/kg i.p., once per day for 3 d) at 72 h after cisplatin (20 mg/kg) or saline treatment. B, Quantitative analysis of protein expression of LC3II in kidneys of mice. ***P < .001 vs Sham Vehicle; + P < .05 vs TAK1 inhibitor Cisplatin; # P < .05 vs Vehicle Cisplatin. n = 6 in each group. C, Quantitative analysis of protein expression of p62 in kidneys of mice. ***P < .001 vs Sham Vehicle; + P < .05 vs TAK1 inhibitor Cisplatin; # P < .05 vs Vehicle Cisplatin. n = 6 in each group. D, Representative Western blots show LC3 I/II and p62 protein expression in kidneys of vehicle group and 3‐MA group mice (3‐MA, 20 mg/kg/d, i.p., once per day for 3 d) at 72 h after cisplatin (20 mg/kg) or saline treatment. E, Quantitative analysis of protein expression of LC3II in kidneys of mice. ***P < .001 vs Sham Vehicle; + P < .05 vs 3‐MA Cisplatin; # P < .05 vs Vehicle Cisplatin. n = 6 in each group. F, Quantitative analysis of protein expression of p62 in kidneys of mice. ***P < .001 vs Sham Vehicle; + P < .05 vs 3‐MA Cisplatin; # P < .05 vs Vehicle Cisplatin. n = 6 in each group. G, PAS staining for kidney sections of vehicle group and 3‐MA group mice at 72 h after cisplatin or saline treatment (Original magnification: ×400, Scale bar:50 μm). H, Quantitative assessment of tubular damage in mice at 72 h after cisplatin treatment. *P < .05 vs Vehicle Cisplatin. n = 6 in each group
Figure 4
Figure 4
Inhibition of TAK1 decreased phosphorylation of p38 and ERK in kidneys of mice with cisplatin‐induced AKI. A, Representative Western blots show p38 protein expression in kidneys of vehicle group and TAK1 inhibitor group mice (5Z‐7‐oxozeaenol, 4 mg/kg i.p., once per day for 3 d) at 72 h after cisplatin (20 mg/kg) or saline treatment. B, Quantitative analysis of protein expression ratio of phosphorylated p38 and total p38 in kidneys of mice. ***P < .001 vs Sham Vehicle; + P < .05 vs TAK1 inhibitor Cisplatin; # P < .05 vs Vehicle Cisplatin. n = 6 in each group. C, Representative Western blots show ERK protein expression in kidneys of vehicle group and TAK1 inhibitor group mice at 72 h after cisplatin or saline treatment. D, Quantitative analysis of protein expression ratio of phosphorylated ERK and total ERK in kidneys of mice. ***P < .001 vs Sham Vehicle; + P < .05 vs TAK1 inhibitor Cisplatin; # P < .05 vs Vehicle Cisplatin. n = 6 in each group
Figure 5
Figure 5
Inhibition of TAK1 decreases autophagy in renal tubular epithelial cells treated with cisplatin in vitro. A, GFP‐LC3 staining with vehicle and TAK1 inhibitor pre‐treated renal tubular epithelial cells treated with cisplatin (10 μg/mL, 6 h) or sham in vitro (Original magnification: ×100). B, Quantitative analysis of autophagosome with LC3 fluorescent spot (green). *P < .05 vs Sham Vehicle; + P < .05 vs TAK1 inhibitor Cisplatin; # P < .05 vs Vehicle Cisplatin. n = 4 in each group. C, Representative Western blots show LC3 I/II and p62 protein expression in vehicle and TAK1 inhibitor (5Z‐7‐oxozeaenol, 10 μmol/L, pre‐treated for 1 h) pre‐treated renal tubular epithelial cells treated with cisplatin (10 μg/mL, 6 h) or sham in vitro. D. Quantitative analysis of protein expression of LC3II in renal tubular epithelial cells. ***P < .001 vs Sham Vehicle; + P < .05 vs TAK1 inhibitor Cisplatin; # P < .05 vs Vehicle Cisplatin. n = 4 in each group. E. Quantitative analysis of protein expression of p62 in renal tubular epithelial cells. ***P < .001 vs Sham Vehicle; + P < .05 vs TAK1 inhibitor Cisplatin; # P < .05 vs Vehicle Cisplatin. n = 4 in each group. F. Representative Western blots show LC3 I/II and p62 protein expression in vehicle and 3‐MA (3‐MA, 10 μmol/L, pre‐treated for 1 h) pre‐treated renal tubular epithelial cells treated with cisplatin (10 μg/mL, 6 h) or sham in vitro. G, Quantitative analysis of protein expression of LC3II in renal tubular epithelial cells. ***P < .001 vs Sham Vehicle; + P < .05 vs 3‐MA Cisplatin; # P < .05 vs Vehicle Cisplatin. n = 4 in each group. H, Quantitative analysis of protein expression of p62 in renal tubular epithelial cells. ***P < .001 vs Sham Vehicle; + P < .05 vs 3‐MA Cisplatin; # P < .05 vs Vehicle Cisplatin. n = 4 in each group
Figure 6
Figure 6
Up‐regulation of TAK1 increases autophagy in renal tubular epithelial cells treated with cisplatin in vitro. A, GFP‐LC3 staining with vehicle and TAK1 overexpression plasmid pre‐treated renal tubular epithelial cells treated with cisplatin (10 μg/mL, 6 h) or sham in vitro (Original magnification: ×100). B, Quantitative analysis of autophagosome with LC3 fluorescent spot (green). *P < .05 vs Sham Vehicle; + P < .05 vs TAK1 overexpression Cisplatin; # P < .05 vs Vehicle Cisplatin. n = 4 in each group. C, Representative Western blots show LC3 I/II and p62 protein expression in vehicle and TAK1 overexpression plasmid pre‐treated renal tubular epithelial cells treated with cisplatin (10 μg/mL, 6 h) or sham in vitro. D, Quantitative analysis of protein expression of LC3II in renal tubular epithelial cells. ***P < .001 vs Sham Vehicle; +++ P < .001 vs TAK1 overexpression Cisplatin; # P < .05 vs Vehicle Cisplatin. n = 4 in each group. E, Quantitative analysis of protein expression of p62 in renal tubular epithelial cells. ***P < .001 vs Sham Vehicle; +++ P < .001 vs TAK1 overexpression Cisplatin; # P < .05 vs Vehicle Cisplatin. n = 4 in each group. F, Representative Western blots show LC3 I/II and p62 protein expression in TAK1 overexpression plasmid and TAK1 overexpression plasmid plus 3‐MA (10 μmol/L) pre‐treated renal tubular epithelial cells treated with cisplatin (10 μg/mL, 6 h) or sham in vitro. G, Quantitative analysis of protein expression of LC3II in renal tubular epithelial cells. ***P < .001 vs Sham Vehicle; + P < .05 vs TAK1 overexpression Cisplatin; # P < .05 vs Vehicle Cisplatin. n = 4 in each group. H, Quantitative analysis of protein expression of p62 in renal tubular epithelial cells. ***P < .001 vs TAK1 overexpression Sham; + P < .05 vs TAK1 overexpression plus 3‐MA Cisplatin; # P < .05 vs TAK1 overexpression Cisplatin. n = 4 in each group
Figure 7
Figure 7
Inhibition of TAK1 or TAK1 knock‐down decreases p38 and ERK phosphorylation of renal tubular epithelial cells with cisplatin treatment. A, Representative Western blots showed phosphorylation levels of p38 and ERK in vehicle or TAK1 inhibitor pre‐treated renal tubular epithelial cells of mice with cisplatin 10 μg/mL or sham treatment 6 h. B, Quantitative analysis of p38 phosphorylation in vehicle or TAK1 inhibitor pre‐treated renal tubular epithelial cells with cisplatin or sham treatment. ***P < .001 vs Sham Vehicle; + P < .05 vs TAK1 inhibitor Cisplatin; # P < .05 vs Vehicle Cisplatin. n = 4 in each group. C, Quantitative analysis of ERK phosphorylation in vehicle or TAK1 inhibitor pre‐treated renal tubular epithelial cells with cisplatin or sham treatment. ***P < .001 vs Sham Vehicle; + P < .05 vs TAK1 inhibitor Cisplatin; # P < .05 vs Vehicle Cisplatin. n = 4 in each group. D, Representative Western blots showed phosphorylation levels of p38 and ERK in vehicle or TAK1 siRNA pre‐treated renal tubular epithelial cells of mice with cisplatin (10 μg/mL, 6 h) or sham in vitro. E, Quantitative analysis of p38 phosphorylation. ***P < .001 vs Vehicle Sham; + P < .05 vs TAK1 siRNA Cisplatin; # P < .05 vs Vehicle Cisplatin. n = 4 in each group. F, Quantitative analysis of ERK phosphorylation. ***P < .001 vs Vehicle Sham; + P < .05 vs TAK1 siRNA Cisplatin; # P < .05 vs Vehicle Cisplatin. n = 4 in each group
Figure 8
Figure 8
Up‐regulation of TAK1 increases p38 and ERK phosphorylation of renal tubular epithelial cells with cisplatin treatment. A, Representative Western blots showed phosphorylation levels of p38 and ERK in vehicle or TAK1 overexpression plasmid pre‐treated renal tubular epithelial cells of mice with cisplatin (10 μg/mL, 6 h) or sham in vitro. B, Quantitative analysis of p38 phosphorylation. ***P < .001 vs Sham Vehicle; +++ P < .001 vs TAK1 overexpression Cisplatin; # P < .05 vs Vehicle Cisplatin. n = 4 in each group. C, Quantitative analysis of ERK phosphorylation. ***P < .001 vs Sham Vehicle; +++ P < .001 vs TAK1 overexpression Cisplatin; # P < .05 vs Vehicle Cisplatin. n = 4 in each group. D, GFP‐LC3 staining with TAK1 overexpression plasmid or TAK1 overexpression plasmid plus SB203580 pre‐treated renal tubular epithelial cells treated with cisplatin (10 μg/mL, 6 h) or sham in vitro (Original magnification: ×100). E, Quantitative analysis of autophagosome with LC3 fluorescent spot (green). *P < .05 vs TAK1 overexpression Sham; + P < .05 vs TAK1 overexpression+ SB203580 Cisplatin; # P < .05 vs TAK1 overexpression Cisplatin. n = 4 in each group. F, Quantitative analysis of cells viability with TAK1 overexpression plasmid or TAK1 overexpression plasmid plus SB203580 pre‐treated renal tubular epithelial cells treated with cisplatin or sham in vitro. ***P < .001 vs TAK1 overexpression Sham; + P < .05 vs TAK1 overexpression+ SB203580 Cisplatin; # P < .05 vs TAK1 overexpression Cisplatin. n = 4 in each group. G, GFP‐LC3 staining with TAK1 overexpression plasmid or TAK1 overexpression plasmid plus PD98059 pre‐treated renal tubular epithelial cells treated with cisplatin (10 μg/mL, 6 h) or sham in vitro (Original magnification: ×100). H, Quantitative analysis of autophagosome with LC3 fluorescent spot (green). *P < .05 vs TAK1 overexpression Sham; + P < .05 vs TAK1 overexpression + PD98059 Cisplatin; # P < .05 vs TAK1 overexpression Cisplatin. n = 4 in each group. I, Quantitative analysis of cells viability with TAK1 overexpression plasmid or TAK1 overexpression plasmid plus PD98059 pre‐treated renal tubular epithelial cells treated with cisplatin or sham in vitro. ***P < .001 vs TAK1 overexpression Sham; + P < .05 vs TAK1 overexpression + PD98059 Cisplatin; # P < .05 vs TAK1 overexpression Cisplatin. n = 4 in each group

Similar articles

Cited by

References

    1. Bellmunt J, Pons F, Orsola A. Molecular determinants of response to cisplatin‐based neoadjuvant chemotherapy. Curr Opin Urol. 2013;23:466‐471. - PubMed
    1. Karasawa T, Steyger PS. An integrated view of cisplatin‐induced nephrotoxicity and ototoxicity. Toxicol Lett. 2015;237:219‐227. - PMC - PubMed
    1. Jing K, Lim K. Why is autophagy important in human diseases? Exp Mol Med. 2012;44:69‐72. - PMC - PubMed
    1. Galluzzi L, Vicencio JM, Kepp O, Tasdemir E, Maiuri MC, Kroemer G. To die or not to die: that is the autophagic question. Curr Mol Med. 2008;8:78‐91. - PubMed
    1. Wei K, Wang P, Miao CY. A double‐edged sword with therapeutic potential: an updated role of autophagy in ischemic cerebral injury. CNS Neurosci Ther. 2012;18:879‐886. - PMC - PubMed

Publication types

MeSH terms

Substances