

Silencing of Glucocerebrosidase Gene in Drosophila Enhances the Aggregation of Parkinson's Disease Associated α-Synuclein Mutant A53T and Affects Locomotor Activity
- PMID: 29503608
- PMCID: PMC5820349
- DOI: 10.3389/fnins.2018.00081
Silencing of Glucocerebrosidase Gene in Drosophila Enhances the Aggregation of Parkinson's Disease Associated α-Synuclein Mutant A53T and Affects Locomotor Activity
Abstract
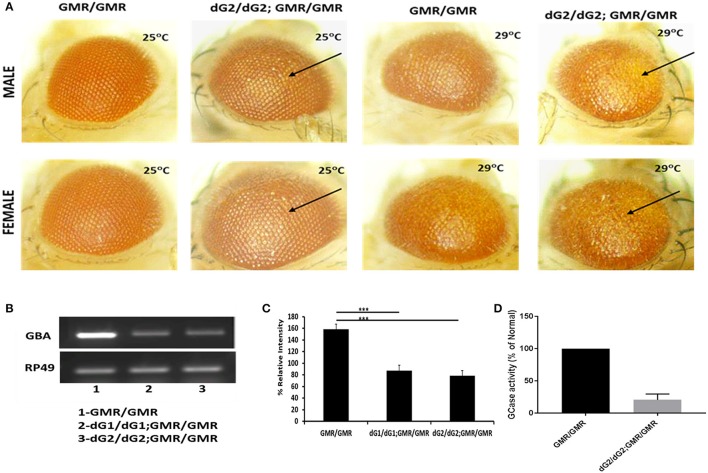
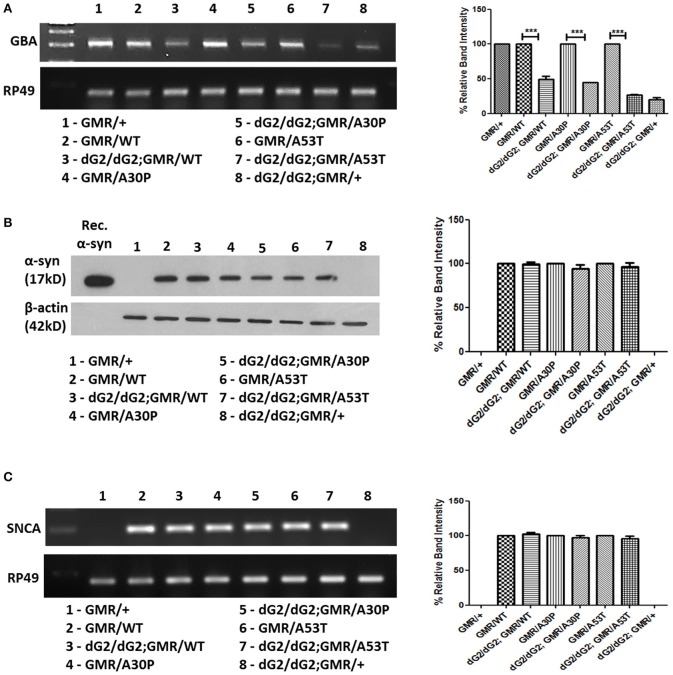
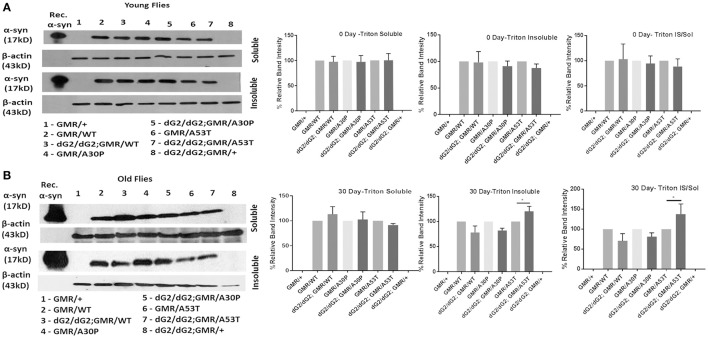
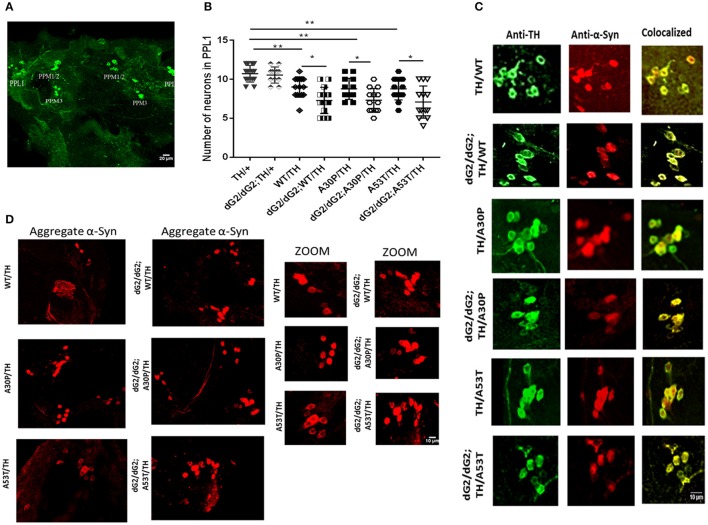
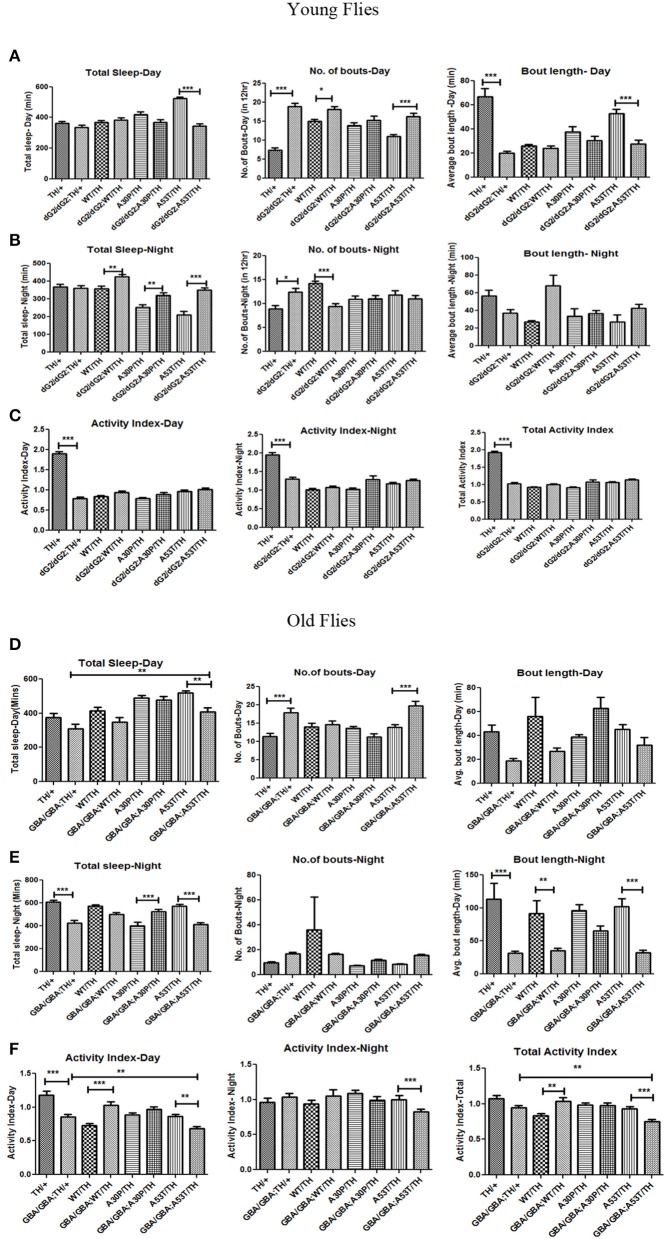
Background: Mutations in glucocerebrosidase (GBA), a lysosomal enzyme are the most common genetic risk factor for developing Parkinson's disease (PD). We studied how reduced GCase activity affects α-synuclein (α-syn) and its mutants (A30P and A53T) aggregation, neurodegeneration, sleep and locomotor behavior in a fly model of PD. Methods: We developed drosophila with GBA gene knockdown (RNAi) (with reduced GCase activity) that simultaneously expresses either wildtype (WT) or mutants such as A30P or A53T α-syn. Western blot and confocal microscopy were performed to study the α-syn aggregation and neurodegeneration in these flies. We also studied the sleep and locomotor activity of those flies using Drosophila activity monitor (DAM) system. Results: Western blot analysis showed that GBA RNAi A53T α-syn flies (30 days old) had an increased level of Triton insoluble synuclein (that corresponds to α-syn aggregates) compared to corresponding A53T flies without GBA RNAi (control), while mRNA expression of α-syn remained unchanged. Confocal imaging of whole brain staining of 30 days old drosophila showed a statistically significant decrease in neuron numbers in PPL1 cluster in flies expressing α-syn WT, A30P and A53T in the presence GBA RNAi compared to corresponding control. Staining with conformation specific antibody for α-syn aggregates showed an increased number of neurons staining for α-syn aggregates in A53T fly brain with GBA RNAi compared to control A53T flies, thus confirming our protein analysis finding that under decreased GBA enzyme activity, mutant A53T aggregates more than the control A53T without GBA silencing. Sleep analysis revealed decreased total activity in GBA silenced flies expressing mutant A53T compared to both A53T control flies and GBA RNAi flies without synuclein expression. Conclusion: In A53T flies with reduced GCase activity, there is increased α-syn aggregation and dopamine (DA) neuronal loss. This study demonstrates that reduced GCase activity both in the context of heterozygous GBA1 mutation associated with PD and in old age, contribute to increased aggregation of mutant α-syn A53T and exacerbates the phenotype in a fly model of PD.
Keywords: Drosophila; GBA; Parkinson's disease; neurodegeneration; sleep behavior; synuclein.
Figures
Similar articles
-
ATP13A2 Gene Silencing in Drosophila Affects Autophagic Degradation of A53T Mutant α-Synuclein.Int J Mol Sci. 2023 Jan 16;24(2):1775. doi: 10.3390/ijms24021775. Int J Mol Sci. 2023. PMID: 36675288 Free PMC article.
-
The association between lysosomal protein glucocerebrosidase and Parkinson's disease.Eur Rev Med Pharmacol Sci. 2013 Jan;17(2):143-51. Eur Rev Med Pharmacol Sci. 2013. Retraction in: Eur Rev Med Pharmacol Sci. 2015;19(2):179. PMID: 23377801 Retracted.
-
Glucocerebrosidase gene therapy prevents α-synucleinopathy of midbrain dopamine neurons.Neurobiol Dis. 2015 Oct;82:495-503. doi: 10.1016/j.nbd.2015.09.009. Epub 2015 Sep 25. Neurobiol Dis. 2015. PMID: 26392287
-
The emerging role of autophagic-lysosomal dysfunction in Gaucher disease and Parkinson's disease.Neural Regen Res. 2017 Mar;12(3):380-384. doi: 10.4103/1673-5374.202934. Neural Regen Res. 2017. PMID: 28469644 Free PMC article. Review.
-
Cross-talks among GBA mutations, glucocerebrosidase, and α-synuclein in GBA-associated Parkinson's disease and their targeted therapeutic approaches: a comprehensive review.Transl Neurodegener. 2021 Jan 15;10(1):4. doi: 10.1186/s40035-020-00226-x. Transl Neurodegener. 2021. PMID: 33446243 Free PMC article. Review.
Cited by
-
The Importance of Drosophila melanogaster Research to UnCover Cellular Pathways Underlying Parkinson's Disease.Cells. 2021 Mar 6;10(3):579. doi: 10.3390/cells10030579. Cells. 2021. PMID: 33800736 Free PMC article. Review.
-
Animal models of Parkinson's disease: bridging the gap between disease hallmarks and research questions.Transl Neurodegener. 2023 Jul 19;12(1):36. doi: 10.1186/s40035-023-00368-8. Transl Neurodegener. 2023. PMID: 37468944 Free PMC article. Review.
-
LRRK2 Kinase Inhibition Rescues Deficits in Lysosome Function Due to Heterozygous GBA1 Expression in Human iPSC-Derived Neurons.Front Neurosci. 2020 May 15;14:442. doi: 10.3389/fnins.2020.00442. eCollection 2020. Front Neurosci. 2020. PMID: 32499675 Free PMC article.
-
Glucocerebrosidase Mutations and Synucleinopathies. Potential Role of Sterylglucosides and Relevance of Studying Both GBA1 and GBA2 Genes.Front Neuroanat. 2018 Jun 28;12:52. doi: 10.3389/fnana.2018.00052. eCollection 2018. Front Neuroanat. 2018. PMID: 30002620 Free PMC article.
-
Lysosomal dysfunction in α-synuclein pathology: molecular mechanisms and therapeutic strategies.Cell Mol Life Sci. 2024 Sep 3;81(1):382. doi: 10.1007/s00018-024-05419-5. Cell Mol Life Sci. 2024. PMID: 39223418 Free PMC article. Review.
References
-
- Aflaki E., Borger D. K., Moaven N., Stubblefield B. K., Rogers S. A., Patnaik S., et al. . (2016). A new glucocerebrosidase chaperone reduces α-synuclein and glycolipid levels in iPSC-derived dopaminergic neurons from patients with gaucher disease and Parkinsonism. J. Neurosci. 36, 7441–7452. 10.1523/JNEUROSCI.0636-16.2016 - DOI - PMC - PubMed
LinkOut - more resources
Full Text Sources
Other Literature Sources
Molecular Biology Databases
Miscellaneous