. 2018 Mar 2;14(3):e1006936.
doi: 10.1371/journal.ppat.1006936. eCollection 2018 Mar.

Nubbin isoform antagonism governs Drosophila intestinal immune homeostasis

Affiliations

Nubbin isoform antagonism governs Drosophila intestinal immune homeostasis

Bo G Lindberg et al. PLoS Pathog. .

Abstract

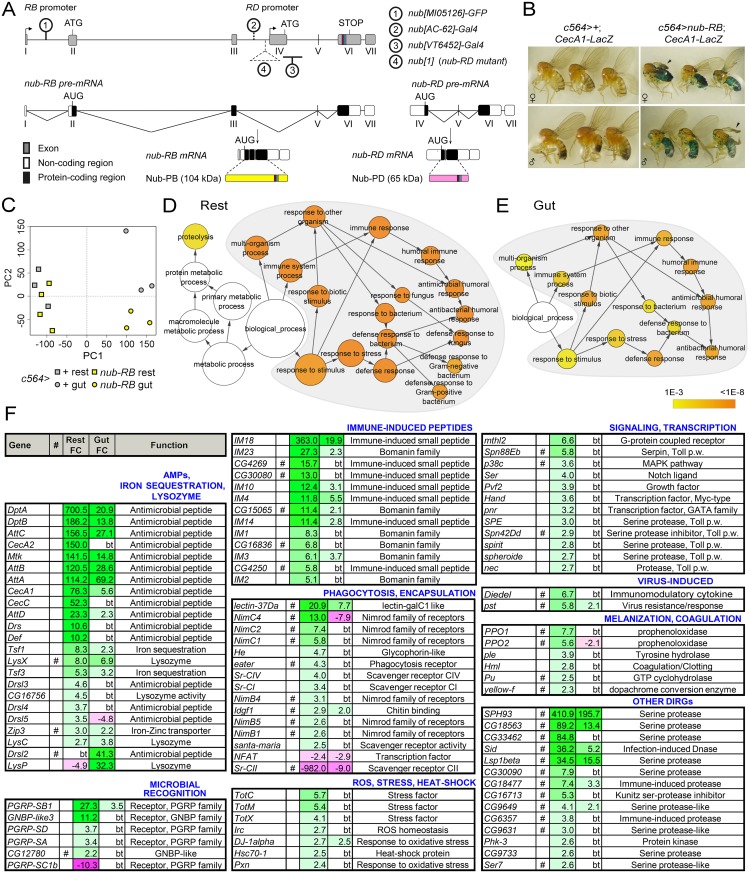
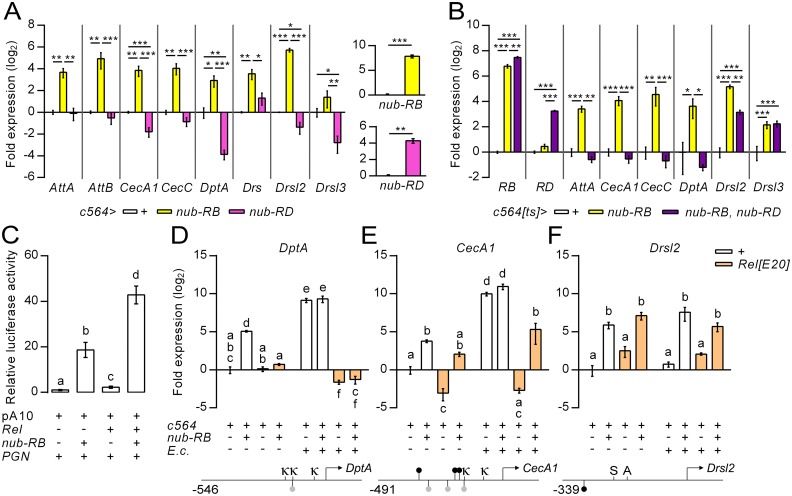
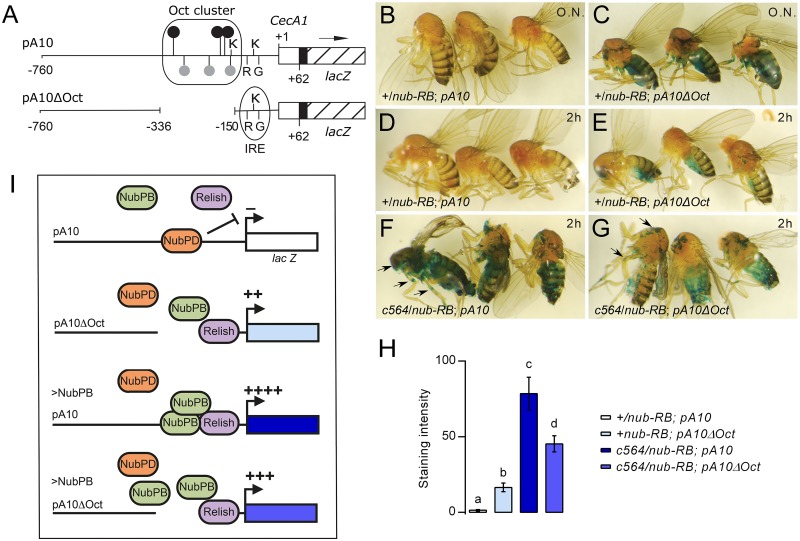
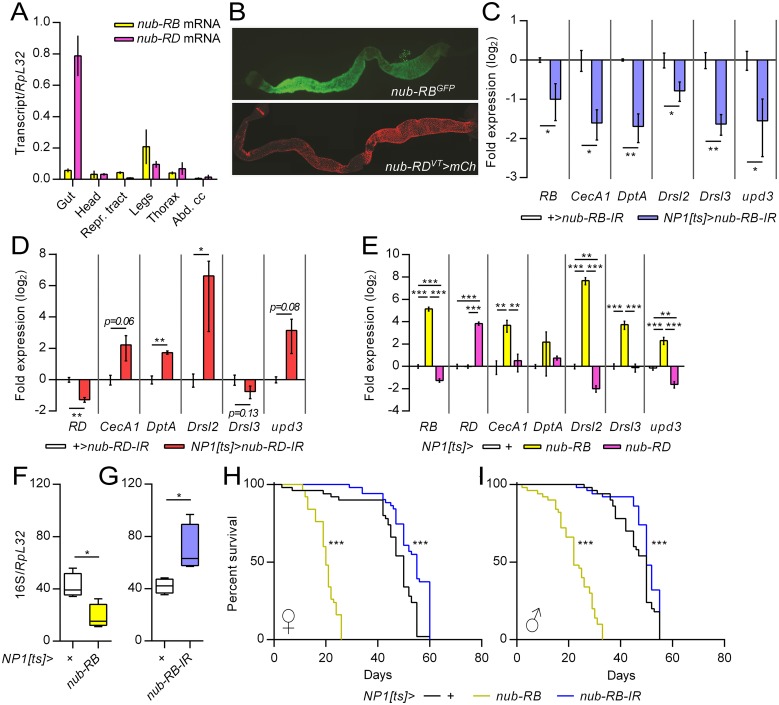
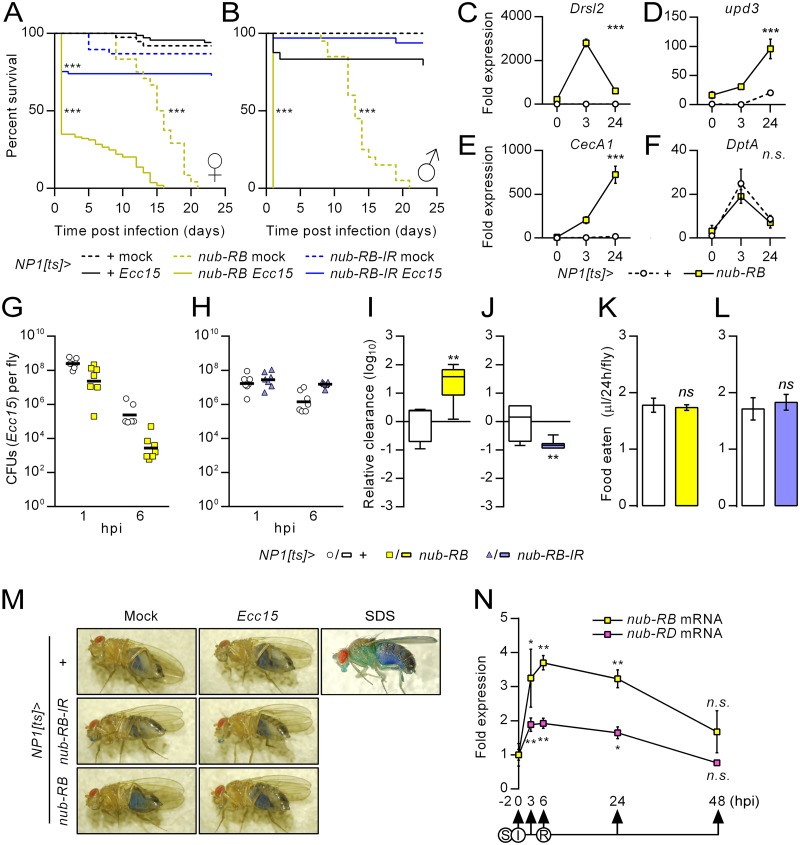
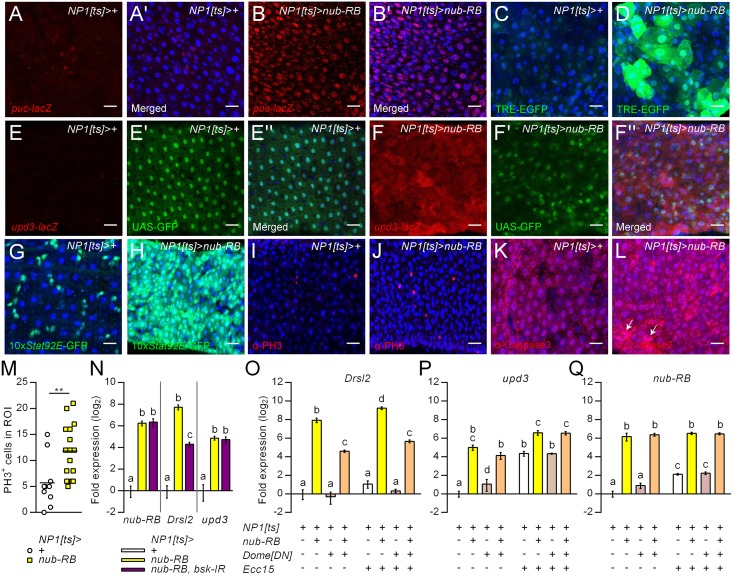
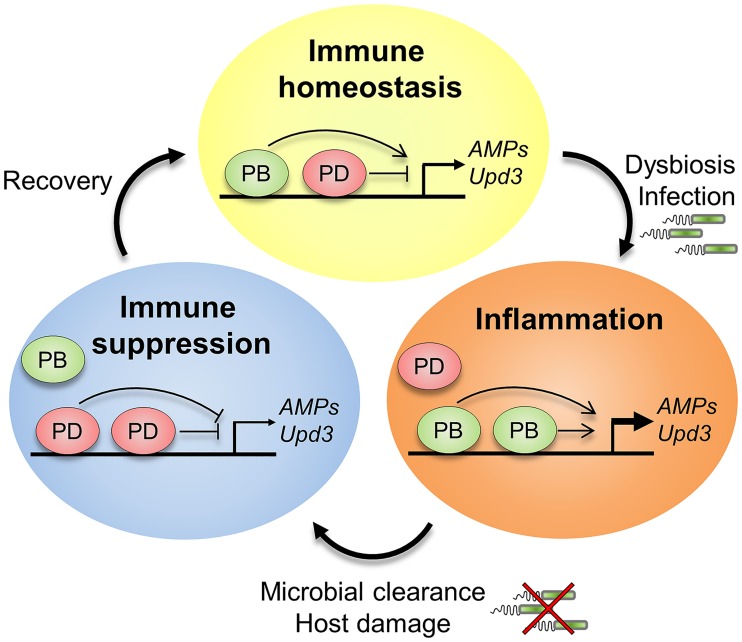
Gut immunity is regulated by intricate and dynamic mechanisms to ensure homeostasis despite a constantly changing microbial environment. Several regulatory factors have been described to participate in feedback responses to prevent aberrant immune activity. Little is, however, known about how transcriptional programs are directly tuned to efficiently adapt host gut tissues to the current microbiome. Here we show that the POU/Oct gene nubbin (nub) encodes two transcription factor isoforms, Nub-PB and Nub-PD, which antagonistically regulate immune gene expression in Drosophila. Global transcriptional profiling of adult flies overexpressing Nub-PB in immunocompetent tissues revealed that this form is a strong transcriptional activator of a large set of immune genes. Further genetic analyses showed that Nub-PB is sufficient to drive expression both independently and in conjunction with nuclear factor kappa B (NF-κB), JNK and JAK/STAT pathways. Similar overexpression of Nub-PD did, conversely, repress expression of the same targets. Strikingly, isoform co-overexpression normalized immune gene transcription, suggesting antagonistic activities. RNAi-mediated knockdown of individual nub transcripts in enterocytes confirmed antagonistic regulation by the two isoforms and that both are necessary for normal immune gene transcription in the midgut. Furthermore, enterocyte-specific Nub-PB expression levels had a strong impact on gut bacterial load as well as host lifespan. Overexpression of Nub-PB enhanced bacterial clearance of ingested Erwinia carotovora carotovora 15. Nevertheless, flies quickly succumbed to the infection, suggesting a deleterious immune response. In line with this, prolonged overexpression promoted a proinflammatory signature in the gut with induction of JNK and JAK/STAT pathways, increased apoptosis and stem cell proliferation. These findings highlight a novel regulatory mechanism of host-microbe interactions mediated by antagonistic transcription factor isoforms.


Conflict of interest statement

The authors have declared that no competing interests exist.

Figures

Fig 1
Fig 1. Nub-PB, encoded from the nub gene locus, is a strong activator of immune-regulated genes in vivo.
(A) The nub gene locus encodes the nub-RB and nub-RD transcripts from separate promoters, resulting in Nub-PB (104 kDa; yellow) and Nub-PD (65 kDa; magenta) proteins, respectively. POUS (dark red box), and POUH (turquoise box) are indicated. Nub-specific insertion mutants and Gal4 drivers are indicated with encircled numbers on the gene, and with a key in the right panel. (B) Overexpression of nub-RB by c564-Gal4 activates CecA1-lacZ expression in fat body (blue). Adult females were maintained at 25 °C prior to fixation and overnight β-gal staining. Arrowheads indicate an unfolded wing phenotype frequently scored in flies with nub-RB overexpression. (C-E) Analysis of global mRNA expression profiles in gut tissues and carcasses without heads (rest) from flies overexpressing nub-RB (c564>nub-RB) in comparison to controls (c564>+). (C) Principal component analysis was conducted using all transcripts found to be expressed over background signal in at least one cohort. Samples are colored group-wise according to genotype and subdivided according to tissue, i.e. dissected intestines (gut) and body without head and gut (rest). (D-E) Gene set enrichment analysis (GSEA) of the transcripts found upregulated in “rest” (795 hits; D) and “gut” (159; E). The orange nodes corresponding to different Gene Ontology clusters were found with increasing statistical significance after Benjamini and Hochberg FDR correction (p<10−3) whereas non-colored nodes were considered non-significant (p>10−3). Circle sizes reflect the number of genes found within each biological process. The gray-zoned areas highlight statistically enriched nodes relating to immune system processes. (F) Merged list of selected, differentially expressed DIRGs (see S5 Table for full list). Fold changes (FC) reflect mean values from 3–4 independent biological replicates; bt, below signal or significance threshold; # putative DIRGs derived from https://lemaitrelab.epfl.ch/resources; p.w., pathway.
Fig 2
Fig 2. Nub-PB and Nub-PD regulate the same genes in an antagonistic and Relish-dependent manner.
(A) Quantification of relative mRNA expression from selected AMP genes along with each isoform of nub (inserts), from whole fly extracts using RT-qPCR following overexpression of nub-RB (yellow bars) or nub-RD (magenta bars) using c564>Gal4 (means ± SE, N = 3). (B) Quantification of relative mRNA expression from selected AMP genes along with each isoform of nub (inserts), from whole fly extracts using RT-qPCR following overexpression of nub-RB (yellow bars) or both (purple bars) using c564>Gal4ts (means ± SE, N = 4). (C) Transfection of mbn-2 cells with a pA10-CecA1-luc construct (15) with or without expression plasmids for nub-RB and/or Rel. Cells were subsequently stimulated with bacterial peptidoglycan (in the form of crude LPS) to induce a robust immune response. The graph depicts mean values of relative luciferase activity ± SE (N = 3). (D-F) Quantification of relative mRNA expression from selected AMP genes using RT-qPCR following c564-driven overexpression of nub-RB, with or without a Rel mutant background (RelE20, orange bars) compared to controls and with or without systemic infection with E. cloacae (means ± SE; N = 3). Lower panels display proximal promoter regions of DptA, CecA1 and Drsl2. Oct (ATSBAAAW; ●), and Oct-like (ATTCAAAT; ) motifs are depicted in the proximal promoter region of each gene [15]. κ = κB-site; S = Stat92E-site; A = AP-1 site. Bars represent means ± SE. Asterisks and distinct letters denote significant differences (*p<0.05; **p<0.01; ***p<0.001; distinct lettering, p<0.05).
Fig 3
Fig 3. The Oct motif cluster is required for both Nub-PD-dependent repression and Nub-PB-driven activation of the CecA1-lacZ reporter.
(A) Schematic representation of the CecA1-lacZ-constructs carried by transgenic fly strains. The pA10 construct contains 760 bp of 5’ upstream region from the CecA1 gene (horizontal line), and 62 bp of 5’ UTR (open box) fused to an SV40 leader (filled box), providing a translational start site in frame with the E. coli lacZ coding sequence (hatched box) [15, 47]. Numbers refer to positions relative to the transcription start site (+1). Location of regulatory sequence motifs, as indicated by symbols and letters, is in scale. A previously characterized infection-induced response element (IRE) contains a κB-like site (“κ”), GATA site (“G”) and R1 site (“R”), and an additional κB site located 5′ in close proximity of the IRE [56]. The cluster of Oct sequence motifs contains several consensus Oct sequences (●) and Oct-like () sequences [15]. The pA10ΔOct construct has an internal deletion of the whole Oct cluster (−336 to −150) but is otherwise identical to the pA10 construct. (B-G) CecA1-driven β-gal staining in fat body and other tissues in female flies carrying either the pA10 construct (B, D, F) or the pA10ΔOct construct (C, E, G), in combination with c564-Gal4 driven overexpression of nub-RB (F, G) or in control flies without c564-Gal4 (B-E), with the genotypes as indicated. Incubation with the β-gal substrate X-gal was either carried out overnight (O.N.) or for 2 h (D-G). Note the reporter gene expression in the thorax region and legs (F-G) as indicated by arrows. (H) Estimate of X-gal intensity, by conversion of blue pixels in images to 8-bit grayscale values ranging from 0 (white, no staining) to 255 (black) (N = 6). Group letters denote significantly different cohorts (p<0.05). (I) Schematic model of CecA1-lacZ regulation by Nub-PD and Nub-PB via the Oct sequence cluster. Nub-PD (orange) binds to the Oct cluster and prevents CecA1 expression in healthy flies, also in the presence of Relish (blue) and Nub-PB (green) (B and D). In constructs lacking the Oct cluster (pA10ΔOct), Nub-PD cannot bind and repress the CecA1 promoter, which leads to moderate activation (++) of reporter gene expression (C and E). Overexpressed Nub-PB will compete with Nub-PD for binding to the Oct cluster and hyperactivates (++++) expression from the intact promoter (F), while the activation is not as prominent (+++) in constructs lacking the Oct cluster (G).
Fig 4
Fig 4. Nub isoforms regulate immune genes in midgut enterocytes.
(A) Relative transcript levels of nub-RB (yellow) and nub-RD (magenta) in extracts of adult body parts and tissues as indicated were quantified by RT-qPCR (N = 3). (B) Expression of reporter genes in adult female guts under the control of the RB-promoter (nubMI05126-GFP; upper panel) and PD-promoter (nubVT6452-Gal4>mCherry; lower panel). (C-D) RT-qPCR of selected immune genes from midgut extracts following RNAi-mediated knockdown of nub-RB (C; blue) or nub-RD (D; red) in midgut enterocytes using NP1-Gal4ts and compared to controls (white); N = 3. (E) RT-qPCR of AMP genes and upd3 from midgut extracts following NP1ts-driven overexpression of either nub isoform, compared to controls. (F-G) qPCR analysis of bacterial 16S rDNA relative to host genomic vvl levels (internal control) from dissected midguts following overexpression (F; yellow) or RNAi of nub-RB (G; blue) in midgut enterocytes by NP1-Gal4ts, relative to controls (white). (H-I) Lifespan assays of female (H) and male (I) flies after overexpression (yellow) or downregulation (blue) of nub-RB (for statistics, see S6 Fig). Bars reflect means ± SE and asterisks denote significant differences (*p<0.05; **p<0.01; ***p<0.001).
Fig 5
Fig 5. Enterocyte-specific nub-RB overexpression renders flies hypersensitive to infection despite increased AMP levels and enhanced pathogen clearance.
(A-B) Survival curves of mock-infected (dashed lines) or Ecc15 orally infected female and male flies (filled lines), after simultaneous overexpression (yellow) or downregulation of nub-RB (blue) compared to controls (black) in midgut enterocytes using NP1-Gal4ts. Females mock, n = 24–38; females infected, n = 67–109; males mock, n = 20; males infected, n = 24–32. The graphs are representative of two independent experiments. (C-F) Quantification of relative mRNA expression from whole fly extracts, in uninfected flies or following 3 or 24 h post oral Ecc15 infection, with (yellow rectangles) or without (white circles) simultaneous overexpression of nub-RB in midgut enterocytes. Relative levels were normalized to those of uninfected control flies (set to 1). (G-H) Colony forming units from control flies (white circles), flies with overexpression (yellow squares), or downregulation of nub-RB (blue triangles), orally infected with Ecc15-GFP. Serial dilutions were prepared from whole fly extracts and plated at 1 and 6 hpi. After 1 hpi, remaining flies were transferred to regular food without bacteria. (I-J) Box-Whisker plots (min-max, including outliers) of bacterial clearance from 1 to 6 hpi relative to control flies. (K-L) Capillary feeding assay of the denoted genotypes (N = 5). (M) Representative images of flies from the Smurf assay, initiated at 6 hpi with Ecc15 or control food (Mock) followed by flipping flies onto regular fly food supplemented with blue food dye. No smurfs were recorded within the assayed period (up to two weeks post infection). As control, 5% SDS-supplementation of the food resulted in a high penetrance of smurfs within 3 days (note the blue head and thorax). (N) Post-infection time series of the relative midgut expression of nub transcript forms relative to those at 0 hpi, determined by RT-qPCR (N = 3). Flies (w1118) were starved (S) for 2 h prior to infection (I) on an Ecc15-diet until 6 hpi and subsequently transferred to regular food vials for recovery (R). Bars and boxes denote means ± SE and asterisks (*p<0.05; **p<0.01; ***p<0.001).
Fig 6
Fig 6. Prolonged nub-RB overexpression promotes a proinflammatory signature in the midgut.
(A-L) Immunostainings of adult female posterior midguts after five days of nub-RB overexpression using NP1-Gal4ts compared to driver controls. β-gal staining to highlight puc-lacZ expression (red), a target of the JNK pathway in controls (A-A’), or overexpression flies (B-B’). TRE-GFP (C-D’; green) was additionally applied to confirm JNK-signaling. Enterocyte morphology (green) and upd3-lacZ specific β-gal staining (red) were determined using flies co-expressing UAS-GFP and upd3-lacZ (E-F”). STAT activity was assayed using the reporter 10xStat92E-GFP (G-H; green). Mitotic cells were stained with an antibody directed against PH3 (I-J; red). Cellular apoptosis was detected with α-caspase3 (K-L; red). Channels were merged to depict DAPI-stained nuclei (A’, B’, C-D, E”, F”, G-L; blue). (M) Quantification of PH3 positive cells in the R5 region of the midgut [57]. (N) Expression of selected transcripts from midgut extracts following Nub-PB overexpression alone (yellow) or combined with RNAi against bsk to block JNK signaling (purple), assayed relative to control levels (white; set to 1) by RT-qPCR. (O-Q) Expression of selected transcripts from midgut extracts following overexpression of nub-RB (yellow), UAS-domeDN (gray; to inhibit JAK/STAT signaling) or both (orange), assayed relative to control levels (white; set to 1) by RT-qPCR. The experiment was performed on uninfected flies (-) or 24 h post oral infection with Ecc15 (+). Asterisks and distinct letters (p<0.05) denote significant differences (*p<0.05; **p<0.01; ***p<0.001). Bars and boxes denote means ± SE (N = 3).
Fig 7
Fig 7. Model of the antagonistic actions of Nub isoforms.
A balance between Nub isoforms is required to ensure immune homeostasis in the gut. During normal conditions, Nub-PD interacts with the proximal promoter region of immune-regulated genes to repress aberrant expression. Microbial dysbiosis or oral infection skews the isoform ratio towards Nub-PB, which through an unknown mechanism outcompetes Nub-PD and activates immune gene transcription. Once microbial homeostasis has been reestablished, the equilibrium between the isoforms is regained to balance gut immunity. Uncontrolled expression of Nub-PB or a lack of Nub-PD results in a hyperactivate immune response, loss of tissue homeostasis and early host death.

Similar articles

Cited by

References

    1. Bergman P, Seyedoleslami Esfahani S, Engstrom Y. Drosophila as a Model for Human Diseases-Focus on Innate Immunity in Barrier Epithelia. Curr Top Dev Biol. 2017;121:29–81. doi: 10.1016/bs.ctdb.2016.07.002 - DOI - PubMed
    1. Buchon N, Silverman N, Cherry S. Immunity in Drosophila melanogaster—from microbial recognition to whole-organism physiology. Nat Rev Immunol. 2014;14(12):796–810. doi: 10.1038/nri3763 - DOI - PMC - PubMed
    1. Lindsay SA, Wasserman SA. Conventional and non-conventional Drosophila Toll signaling. Dev Comp Immunol. 2014;42(1):16–24. doi: 10.1016/j.dci.2013.04.011 - DOI - PMC - PubMed
    1. Liu X, Hodgson JJ, Buchon N. Drosophila as a model for homeostatic, antibacterial, and antiviral mechanisms in the gut. PLoS Pathog. 2017;13(5):e1006277 doi: 10.1371/journal.ppat.1006277 - DOI - PMC - PubMed
    1. Mansour SC, Pena OM, Hancock RE. Host defense peptides: front-line immunomodulators. Trends Immunol. 2014;35(9):443–50. doi: 10.1016/j.it.2014.07.004 - DOI - PubMed

Publication types

MeSH terms

Grants and funding

This work was supported by the Swedish Research Council (https://www.vr.se/inenglish.4.12fff4451215cbd83e4800015152.html, grant number 621-2011-4942 to YE) and the Swedish Cancer Society (https://www.cancerfonden.se/om-cancerfonden/about-the-swedish-cancer-society, grant number CAN2014/449 to YE). The funders had no role in study design, data collection and analysis, decision to publish, or preparation of the manuscript.