Blueberry Supplementation Influences the Gut Microbiota, Inflammation, and Insulin Resistance in High-Fat-Diet-Fed Rats
- PMID: 29490092
- PMCID: PMC6251676
- DOI: 10.1093/jn/nxx027
Blueberry Supplementation Influences the Gut Microbiota, Inflammation, and Insulin Resistance in High-Fat-Diet-Fed Rats
Abstract
Background: Gut microbiota dysbiosis has been linked to obesity-associated chronic inflammation. Microbiota manipulation may therefore affect obesity-related comorbidities. Blueberries are rich in anthocyanins, which have anti-inflammatory properties and may alter the gut microbiota.
Objective: We hypothesized that blueberry supplementation would alter the gut microbiota, reduce systemic inflammation, and improve insulin resistance in high-fat (HF)-diet-fed rats.
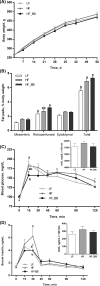
Methods: Twenty-four male Wistar rats (260-270 g; n = 8/group) were fed low-fat (LF; 10% fat), HF (45% fat), or HF with 10% by weight blueberry powder (HF_BB) diets for 8 wk. LF rats were fed ad libitum, whereas HF and HF_BB rats were pair-fed with diets matched for fiber and sugar contents. Glucose tolerance, microbiota composition (16S ribosomal RNA sequencing), intestinal integrity [villus height, gene expression of mucin 2 (Muc2) and β-defensin 2 (Defb2)], and inflammation (gene expression of proinflammatory cytokines) were assessed.
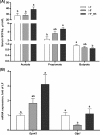
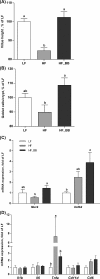
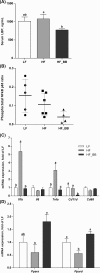
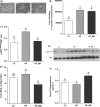
Results: Blueberry altered microbiota composition with an increase in Gammaproteobacteria abundance (P < 0.001) compared with LF and HF rats. HF feeding led to an ∼15% decrease in ileal villus height compared with LF rats (P < 0.05), which was restored by blueberry supplementation. Ileal gene expression of Muc2 was ∼150% higher in HF_BB rats compared with HF rats (P < 0.05), with expression in the LF group not being different from that in either the HF or HF_BB groups. Tumor necrosis factor α (Tnfa) and interleukin 1β (Il1b) gene expression in visceral fat was increased by HF feeding when compared with the LF group (by 300% and 500%, respectively; P < 0.05) and normalized by blueberry supplementation. Finally, blueberry improved markers of insulin sensitivity. Hepatic insulin receptor substrate 1 (IRS1) phosphorylation at serine 307:IRS1 ratio was ∼35% higher in HF rats compared with LF rats (P < 0.05) and HF_BB rats.
Conclusion: In HF-diet-fed male rats, blueberry supplementation led to compositional changes in the gut microbiota associated with improvements in systemic inflammation and insulin signaling.
Figures

Similar articles
-
Potato-Resistant Starch Supplementation Improves Microbiota Dysbiosis, Inflammation, and Gut-Brain Signaling in High Fat-Fed Rats.Nutrients. 2019 Nov 8;11(11):2710. doi: 10.3390/nu11112710. Nutrients. 2019. PMID: 31717368 Free PMC article.
-
Blueberry proanthocyanidins and anthocyanins improve metabolic health through a gut microbiota-dependent mechanism in diet-induced obese mice.Am J Physiol Endocrinol Metab. 2020 Jun 1;318(6):E965-E980. doi: 10.1152/ajpendo.00560.2019. Epub 2020 Mar 31. Am J Physiol Endocrinol Metab. 2020. PMID: 32228321
-
Diet-driven microbiota dysbiosis is associated with vagal remodeling and obesity.Physiol Behav. 2017 May 1;173:305-317. doi: 10.1016/j.physbeh.2017.02.027. Epub 2017 Feb 27. Physiol Behav. 2017. PMID: 28249783 Free PMC article.
-
Beneficial Effects of Anti-Inflammatory Diet in Modulating Gut Microbiota and Controlling Obesity.Nutrients. 2022 Sep 26;14(19):3985. doi: 10.3390/nu14193985. Nutrients. 2022. PMID: 36235638 Free PMC article. Review.
-
Recent Research on the Health Benefits of Blueberries and Their Anthocyanins.Adv Nutr. 2020 Mar 1;11(2):224-236. doi: 10.1093/advances/nmz065. Adv Nutr. 2020. PMID: 31329250 Free PMC article. Review.
Cited by
-
Dietary Fermented Blueberry Pomace Supplementation Improves Small Intestinal Barrier Function and Modulates Cecal Microbiota in Aged Laying Hens.Animals (Basel). 2024 Sep 26;14(19):2786. doi: 10.3390/ani14192786. Animals (Basel). 2024. PMID: 39409735 Free PMC article.
-
Red Bull Energy Drink Impact on Salivary Glands in Wistar Rats: Can Blueberry Extract Reverse the Damage?Nutrients. 2024 Sep 3;16(17):2958. doi: 10.3390/nu16172958. Nutrients. 2024. PMID: 39275275 Free PMC article.
-
Polyphenol-Rich Aronia melanocarpa Fruit Beneficially Impact Cholesterol, Glucose, and Serum and Gut Metabolites: A Randomized Clinical Trial.Foods. 2024 Aug 30;13(17):2768. doi: 10.3390/foods13172768. Foods. 2024. PMID: 39272533 Free PMC article.
-
A Review of the Pharmacological Effects of Solanum muricatum Fruit (Pepino Melon).Foods. 2024 Aug 29;13(17):2740. doi: 10.3390/foods13172740. Foods. 2024. PMID: 39272505 Free PMC article. Review.
-
Use of Guazuma ulmifolia Lam. Stem Bark Extracts to Prevent High-Fat Diet Induced Metabolic Disorders in Mice.Int J Mol Sci. 2024 Aug 15;25(16):8889. doi: 10.3390/ijms25168889. Int J Mol Sci. 2024. PMID: 39201576 Free PMC article.
References
-
- Cancello R, Tordjman J, Poitou C, Guilhem G, Bouillot JL, Hugol D, Coussieu C, Basdevant A, Bar Hen A, Bedossa P et al. . Increased infiltration of macrophages in omental adipose tissue is associated with marked hepatic lesions in morbid human obesity. Diabetes 2006;55:1554–61. - PubMed
-
- Aguirre V, Werner ED, Giraud J, Lee YH, Shoelson SE, White MF. Phosphorylation of Ser307 in insulin receptor substrate-1 blocks interactions with the insulin receptor and inhibits insulin action. J Biol Chem 2002;277:1531–7. - PubMed
Publication types
MeSH terms
Substances
Grants and funding
LinkOut - more resources
Full Text Sources
Other Literature Sources
Molecular Biology Databases
Research Materials
Miscellaneous

