Expanded cellular clones carrying replication-competent HIV-1 persist, wax, and wane
- PMID: 29483265
- PMCID: PMC5856552
- DOI: 10.1073/pnas.1720665115
Expanded cellular clones carrying replication-competent HIV-1 persist, wax, and wane
Abstract
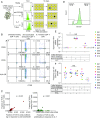
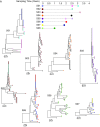
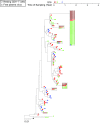
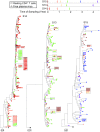
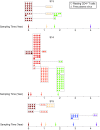
The latent reservoir for HIV-1 in resting CD4+ T cells is a major barrier to cure. Several lines of evidence suggest that the latent reservoir is maintained through cellular proliferation. Analysis of this proliferative process is complicated by the fact that most infected cells carry defective proviruses. Additional complications are that stimuli that drive T cell proliferation can also induce virus production from latently infected cells and productively infected cells have a short in vivo half-life. In this ex vivo study, we show that latently infected cells containing replication-competent HIV-1 can proliferate in response to T cell receptor agonists or cytokines that are known to induce homeostatic proliferation and that this can occur without virus production. Some cells that have proliferated in response to these stimuli can survive for 7 d while retaining the ability to produce virus. This finding supports the hypothesis that both antigen-driven and cytokine-induced proliferation may contribute to the stability of the latent reservoir. Sequencing of replication-competent proviruses isolated from patients at different time points confirmed the presence of expanded clones and demonstrated that while some clones harboring replication-competent virus persist longitudinally on a scale of years, others wax and wane. A similar pattern is observed in longitudinal sampling of residual viremia in patients. The observed patterns are not consistent with a continuous, cell-autonomous, proliferative process related to the HIV-1 integration site. The fact that the latent reservoir can be maintained, in part, by cellular proliferation without viral reactivation poses challenges to cure.
Keywords: HIV persistence; clonal expansion; latent reservoir.
Conflict of interest statement
The authors declare no conflict of interest.
Figures

Similar articles
-
Antibody-Mediated CD4 Depletion Induces Homeostatic CD4+ T Cell Proliferation without Detectable Virus Reactivation in Antiretroviral Therapy-Treated Simian Immunodeficiency Virus-Infected Macaques.J Virol. 2018 Oct 29;92(22):e01235-18. doi: 10.1128/JVI.01235-18. Print 2018 Nov 15. J Virol. 2018. PMID: 30185596 Free PMC article.
-
The forces driving clonal expansion of the HIV-1 latent reservoir.Virol J. 2020 Jan 7;17(1):4. doi: 10.1186/s12985-019-1276-8. Virol J. 2020. PMID: 31910871 Free PMC article. Review.
-
Modeling HIV-1 Latency Using Primary CD4+ T Cells from Virally Suppressed HIV-1-Infected Individuals on Antiretroviral Therapy.J Virol. 2019 May 15;93(11):e02248-18. doi: 10.1128/JVI.02248-18. Print 2019 Jun 1. J Virol. 2019. PMID: 30918072 Free PMC article.
-
Phenotypic analysis of the unstimulated in vivo HIV CD4 T cell reservoir.Elife. 2020 Sep 29;9:e60933. doi: 10.7554/eLife.60933. Elife. 2020. PMID: 32990219 Free PMC article.
-
Reservoirs for HIV-1: mechanisms for viral persistence in the presence of antiviral immune responses and antiretroviral therapy.Annu Rev Immunol. 2000;18:665-708. doi: 10.1146/annurev.immunol.18.1.665. Annu Rev Immunol. 2000. PMID: 10837072 Review.
Cited by
-
Clonally expanded HIV-1 proviruses with 5'-leader defects can give rise to nonsuppressible residual viremia.J Clin Invest. 2023 Mar 15;133(6):e165245. doi: 10.1172/JCI165245. J Clin Invest. 2023. PMID: 36602866 Free PMC article.
-
Cure and Long-Term Remission Strategies.Methods Mol Biol. 2022;2407:391-428. doi: 10.1007/978-1-0716-1871-4_26. Methods Mol Biol. 2022. PMID: 34985678 Review.
-
Insights into the HIV-1 Latent Reservoir and Strategies to Cure HIV-1 Infection.Dis Markers. 2022 May 31;2022:6952286. doi: 10.1155/2022/6952286. eCollection 2022. Dis Markers. 2022. PMID: 35664434 Free PMC article. Review.
-
Review: HIV-1 phylogeny during suppressive antiretroviral therapy.Curr Opin HIV AIDS. 2019 May;14(3):188-193. doi: 10.1097/COH.0000000000000535. Curr Opin HIV AIDS. 2019. PMID: 30882485 Free PMC article. Review.
-
Clonal expansion of SIV-infected cells in macaques on antiretroviral therapy is similar to that of HIV-infected cells in humans.PLoS Pathog. 2019 Jul 10;15(7):e1007869. doi: 10.1371/journal.ppat.1007869. eCollection 2019 Jul. PLoS Pathog. 2019. PMID: 31291371 Free PMC article.
References
Publication types
MeSH terms
Associated data
- Actions
- Actions
- Actions
- Actions
- Actions
- Actions
- Actions
- Actions
- Actions
- Actions
- Actions
- Actions
- Actions
- Actions
Grants and funding
LinkOut - more resources
Full Text Sources
Other Literature Sources
Medical
Molecular Biology Databases
Research Materials

