Metformin attenuates motility, contraction, and fibrogenic response of hepatic stellate cells in vivo and in vitro by activating AMP-activated protein kinase
- PMID: 29467552
- PMCID: PMC5807940
- DOI: 10.3748/wjg.v24.i7.819
Metformin attenuates motility, contraction, and fibrogenic response of hepatic stellate cells in vivo and in vitro by activating AMP-activated protein kinase
Abstract
Aim: To investigate the effect of metformin on activated hepatic stellate cells (HSCs) and the possible signaling pathways involved.
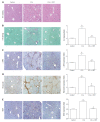
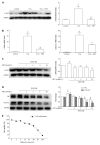
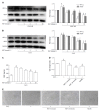
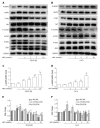
Methods: A fibrotic mouse model was generated by intraperitoneal injection of carbon tetrachloride (CCl4) and subsequent treatment with or without metformin. The level of fibrosis was detected by hematoxylin-eosin staining, Sirius Red staining, and immunohistochemistry. The HSC cell line LX-2 was used for in vitro studies. The effect of metformin on cell proliferation (CCK8 assay), motility (scratch test and Transwell assay), contraction (collagen gel contraction assay), extracellular matrix (ECM) secretion (Western blot), and angiogenesis (ELISA and tube formation assay) was investigated. We also analyzed the possible signaling pathways involved by Western blot analysis.
Results: Mice developed marked liver fibrosis after intraperitoneal injection with CCl4 for 6 wk. Metformin decreased the activation of HSCs, reduced the deposition of ECM, and inhibited angiogenesis in CCl4-treated mice. Platelet-derived growth factor (PDGF) promoted the fibrogenic response of HSCs in vitro, while metformin inhibited the activation, proliferation, migration, and contraction of HSCs, and reduced the secretion of ECM. Metformin decreased the expression of vascular endothelial growth factor (VEGF) in HSCs through inhibition of hypoxia inducible factor (HIF)-1α in both PDGF-BB treatment and hypoxic conditions, and it down-regulated VEGF secretion by HSCs and inhibited HSC-based angiogenesis in hypoxic conditions in vitro. The inhibitory effects of metformin on activated HSCs were mediated by inhibiting the Akt/mammalian target of rapamycin (mTOR) and extracellular signal-regulated kinase (ERK) pathways via the activation of adenosine monophosphate-activated protein kinase (AMPK).
Conclusion: Metformin attenuates the fibrogenic response of HSCs in vivo and in vitro, and may therefore be useful for the treatment of chronic liver diseases.
Keywords: Adenosine monophosphate-activated protein kinase; Angiogenesis; Contraction; Hepatic stellate cell; Intrahepatic vascular resistance; Liver fibrosis.
Conflict of interest statement
Conflict-of-interest statement: The authors declare no conflict of interest related to this manuscript.
Figures


Similar articles
-
Hydroxysafflor yellow A exerts anti-fibrotic and anti-angiogenic effects through miR-29a-3p/PDGFRB axis in liver fibrosis.Phytomedicine. 2024 Sep;132:155830. doi: 10.1016/j.phymed.2024.155830. Epub 2024 Jun 15. Phytomedicine. 2024. PMID: 38959553
-
Metformin ameliorates activation of hepatic stellate cells and hepatic fibrosis by succinate and GPR91 inhibition.Biochem Biophys Res Commun. 2018 Jan 22;495(4):2649-2656. doi: 10.1016/j.bbrc.2017.12.143. Epub 2017 Dec 24. Biochem Biophys Res Commun. 2018. PMID: 29278707
-
Doxazosin Attenuates Liver Fibrosis by Inhibiting Autophagy in Hepatic Stellate Cells via Activation of the PI3K/Akt/mTOR Signaling Pathway.Drug Des Devel Ther. 2021 Aug 21;15:3643-3659. doi: 10.2147/DDDT.S317701. eCollection 2021. Drug Des Devel Ther. 2021. PMID: 34456560 Free PMC article.
-
Hepatic fibrosis: It is time to go with hepatic stellate cell-specific therapeutic targets.Hepatobiliary Pancreat Dis Int. 2018 Jun;17(3):192-197. doi: 10.1016/j.hbpd.2018.04.003. Epub 2018 Apr 21. Hepatobiliary Pancreat Dis Int. 2018. PMID: 29709350 Review.
-
Hepatic stellate cells role in the course of metabolic disorders development - A molecular overview.Pharmacol Res. 2021 Aug;170:105739. doi: 10.1016/j.phrs.2021.105739. Epub 2021 Jun 23. Pharmacol Res. 2021. PMID: 34171492 Review.
Cited by
-
Using Advanced Bioinformatics Tools to Identify Novel Therapeutic Candidates for Proliferative Vitreoretinopathy.Transl Vis Sci Technol. 2023 May 1;12(5):19. doi: 10.1167/tvst.12.5.19. Transl Vis Sci Technol. 2023. PMID: 37191619 Free PMC article.
-
The evidence of metabolic-improving effect of metformin in Ay/a mice with genetically-induced melanocortin obesity and the contribution of hypothalamic mechanisms to this effect.PLoS One. 2019 Mar 14;14(3):e0213779. doi: 10.1371/journal.pone.0213779. eCollection 2019. PLoS One. 2019. PMID: 30870482 Free PMC article.
-
Diabetes Mellitus and Risk of Hepatic Fibrosis/Cirrhosis.Biomed Res Int. 2019 Apr 4;2019:5308308. doi: 10.1155/2019/5308308. eCollection 2019. Biomed Res Int. 2019. PMID: 31080822 Free PMC article. Review.
-
Competitive glucose metabolism as a target to boost bladder cancer immunotherapy.Nat Rev Urol. 2020 Feb;17(2):77-106. doi: 10.1038/s41585-019-0263-6. Epub 2020 Jan 17. Nat Rev Urol. 2020. PMID: 31953517 Review.
-
Metformin and Fibrosis: A Review of Existing Evidence and Mechanisms.J Diabetes Res. 2021 Apr 29;2021:6673525. doi: 10.1155/2021/6673525. eCollection 2021. J Diabetes Res. 2021. PMID: 34007848 Free PMC article. Review.
References
-
- Fernández M, Semela D, Bruix J, Colle I, Pinzani M, Bosch J. Angiogenesis in liver disease. J Hepatol. 2009;50:604–620. - PubMed
-
- Thabut D, Shah V. Intrahepatic angiogenesis and sinusoidal remodeling in chronic liver disease: new targets for the treatment of portal hypertension? J Hepatol. 2010;53:976–980. - PubMed
-
- Gracia-Sancho J, Maeso-Díaz R, Fernández-Iglesias A, Navarro-Zornoza M, Bosch J. New cellular and molecular targets for the treatment of portal hypertension. Hepatol Int. 2015;9:183–191. - PubMed
MeSH terms
Substances
LinkOut - more resources
Full Text Sources
Other Literature Sources
Medical
Miscellaneous

