

Near-tetraploid cancer cells show chromosome instability triggered by replication stress and exhibit enhanced invasiveness
- PMID: 29452566
- PMCID: PMC5998968
- DOI: 10.1096/fj.201700247RR
Near-tetraploid cancer cells show chromosome instability triggered by replication stress and exhibit enhanced invasiveness
Abstract
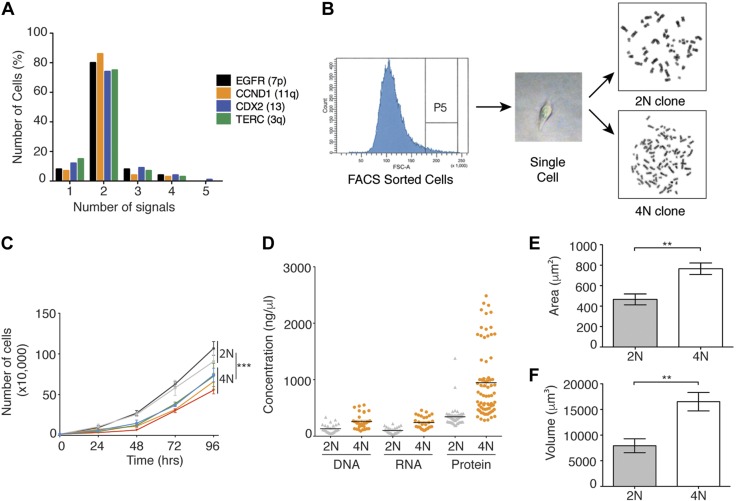
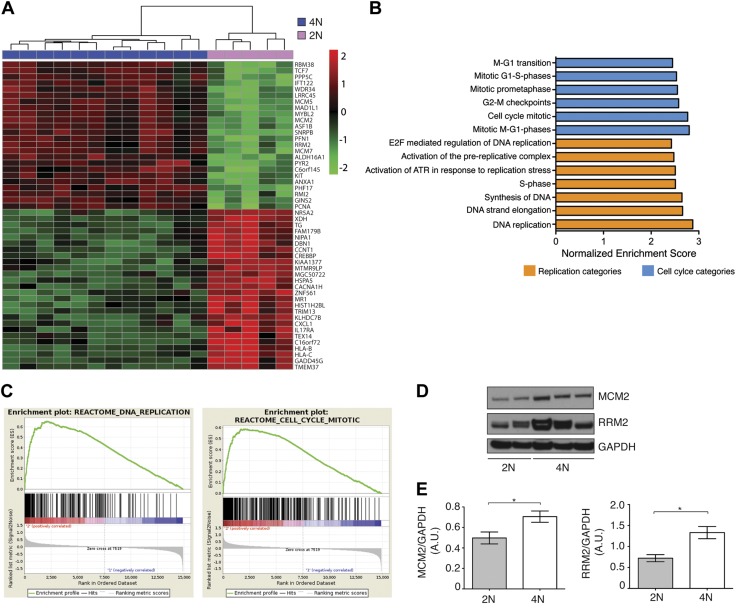
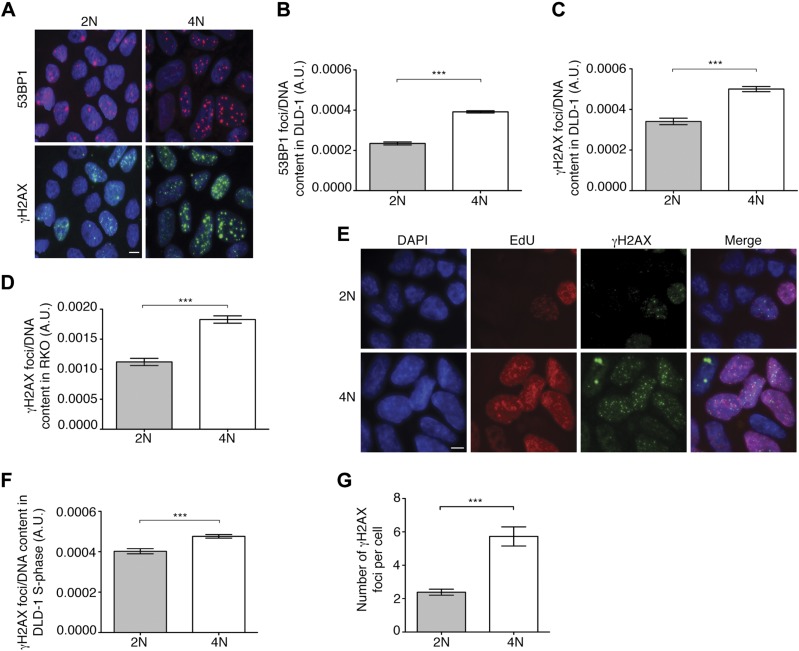
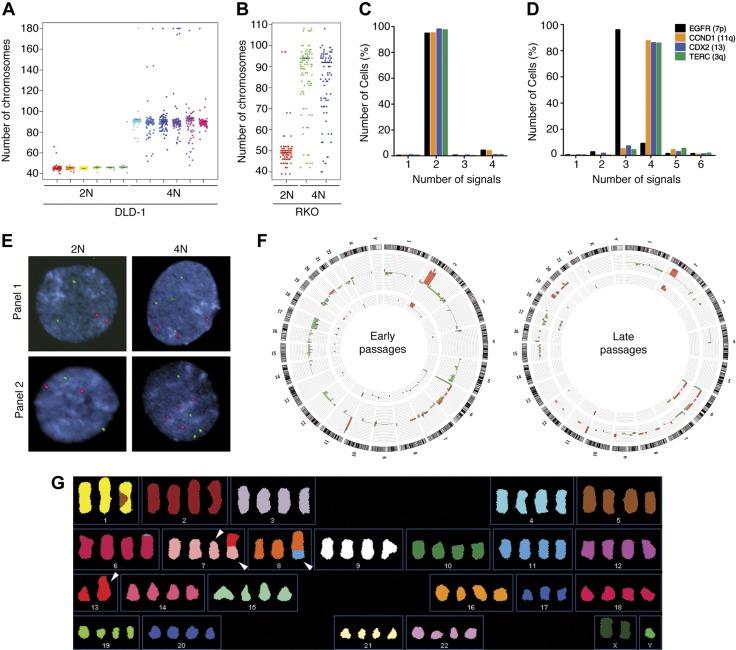
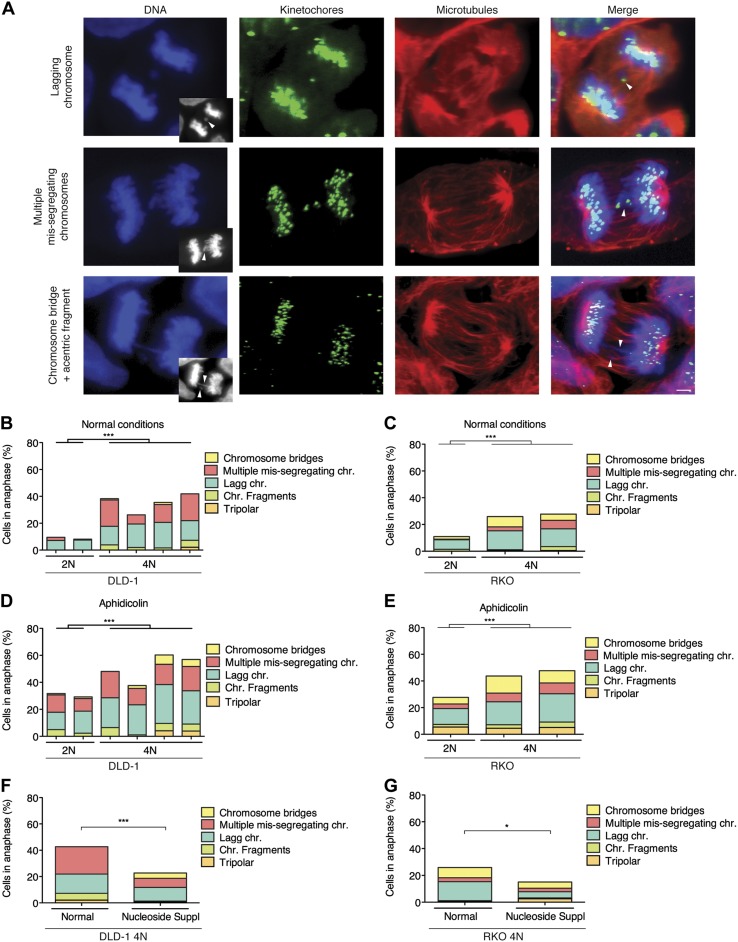
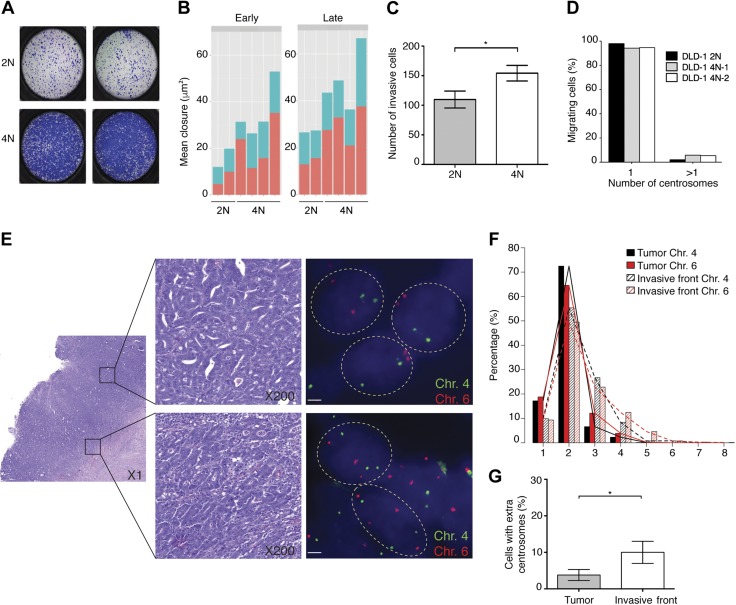
A considerable proportion of tumors exhibit aneuploid karyotypes, likely resulting from the progressive loss of chromosomes after whole-genome duplication. Here, by using isogenic diploid and near-tetraploid (4N) single-cell-derived clones from the same parental cell lines, we aimed at exploring how polyploidization affects cellular functions and how tetraploidy generates chromosome instability. Gene expression profiling in 4N clones revealed a significant enrichment of transcripts involved in cell cycle and DNA replication. Increased levels of replication stress in 4N cells resulted in DNA damage, impaired proliferation caused by a cell cycle delay during S phase, and higher sensitivity to S phase checkpoint inhibitors. In fact, increased levels of replication stress were also observed in nontransformed, proliferative posttetraploid RPE1 cells. Additionally, replication stress promoted higher levels of intercellular genomic heterogeneity and ongoing genomic instability, which could be explained by high rates of mitotic defects, and was alleviated by the supplementation of exogenous nucleosides. Finally, our data found that 4N cancer cells displayed increased migratory and invasive capacity, both in vitro and in primary colorectal tumors, indicating that tetraploidy can promote aggressive cancer cell behavior.-Wangsa, D., Quintanilla, I., Torabi, K., Vila-Casadesús, M., Ercilla, A., Klus, G., Yuce, Z., Galofré, C., Cuatrecasas, M., Lozano, J. J., Agell, N., Cimini, D., Castells, A., Ried, T., Camps, J. Near-tetraploid cancer cells show chromosome instability triggered by replication stress and exhibit enhanced invasiveness.
Keywords: aneuploidy; colorectal cancer; genomic instability; invasive front; lagging chromosomes.
Conflict of interest statement
The authors thank Z. Storchova (Technische Universität Kaiserslautern, Kaiserslauter, Germany) for kindly providing cell lines; A. Bosch and M. Calvo (University of Barcelona) for assessing the data analysis; and Z. Wong [U.S. National Institutes of Health (NIH)], R. Ebner (NIH), and S. D. Rutledge (Virginia Tech) for critical reading. The authors are also grateful to B. Chen (NIH) for editorial assistance. This work was supported by the Intramural Program of the NIH, the CIBEREHD Program, and grants to J.C. from Instituto de Salud Carlos III, and cofunded by the European Regional Development Fund (ERDF) (CP13/00160 and PI14/00783), the European Commission MC-CIG (COLONGEVA), the Spanish Association Against Cancer (AECC, GCB13131592CAST), and the Agència de Gestió d’Ajuts Universitaris i de Recerca, Generalitat de Catalunya (2014 SGR 135 and 2014 SGR 903). Further support was provided by National Service Foundation (NSF) Grant MCB-1517506 to D.C. I.Q., and M.V.-C. received a Formación de Profesorado Universitario (FPU)-fellowship from Ministerio de Educación, Cultura y Deporte; K.T. received a Personal Investigador en Formació from the Universitat Autònoma de Barcelona; A.E. received a Formación de Personal Investigador (FPI) fellowship from Ministerio de Ciencia e Innovación; and Z.Y. received a fellowship from the Scientific and Technological Research Council of Turkey (TUBITAK) 2219 Program. CIBEREHD is funded by the Instituto de Salud Carlos III. The authors declare no conflicts of interest.
Figures

Similar articles
-
Genetic instability from a single S phase after whole-genome duplication.Nature. 2022 Apr;604(7904):146-151. doi: 10.1038/s41586-022-04578-4. Epub 2022 Mar 30. Nature. 2022. PMID: 35355016 Free PMC article.
-
Quantitative proteomic and phosphoproteomic comparison of human colon cancer DLD-1 cells differing in ploidy and chromosome stability.Mol Biol Cell. 2018 May 1;29(9):1031-1047. doi: 10.1091/mbc.E17-10-0577. Mol Biol Cell. 2018. PMID: 29496963 Free PMC article.
-
Deregulation of the centrosome cycle and the origin of chromosomal instability in cancer.Adv Exp Med Biol. 2005;570:393-421. doi: 10.1007/1-4020-3764-3_14. Adv Exp Med Biol. 2005. PMID: 18727509 Review.
-
Possible causes of chromosome instability: comparison of chromosomal abnormalities in cancer cell lines with mutations in BRCA1, BRCA2, CHK2 and BUB1.Cytogenet Genome Res. 2004;104(1-4):333-40. doi: 10.1159/000077512. Cytogenet Genome Res. 2004. PMID: 15162061
-
Illicit survival of cancer cells during polyploidization and depolyploidization.Cell Death Differ. 2011 Sep;18(9):1403-13. doi: 10.1038/cdd.2010.145. Epub 2010 Nov 12. Cell Death Differ. 2011. PMID: 21072053 Free PMC article. Review.
Cited by
-
Prognostic value of nucleotyping, DNA ploidy and stroma in high-risk stage II colon cancer.Br J Cancer. 2020 Sep;123(6):973-981. doi: 10.1038/s41416-020-0974-8. Epub 2020 Jul 6. Br J Cancer. 2020. PMID: 32624576 Free PMC article.
-
Tetraploidy-linked sensitization to CENP-E inhibition in human cells.Mol Oncol. 2023 Jun;17(6):1148-1166. doi: 10.1002/1878-0261.13379. Epub 2023 Feb 11. Mol Oncol. 2023. PMID: 36688680 Free PMC article.
-
Cells in the polyaneuploid cancer cell (PACC) state have increased metastatic potential.Clin Exp Metastasis. 2023 Aug;40(4):321-338. doi: 10.1007/s10585-023-10216-8. Epub 2023 Jun 16. Clin Exp Metastasis. 2023. PMID: 37326720 Free PMC article.
-
Transcriptome Profiling of Mouse Embryonic Fibroblast Spontaneous Immortalization: A Comparative Analysis.Int J Mol Sci. 2024 Jul 25;25(15):8116. doi: 10.3390/ijms25158116. Int J Mol Sci. 2024. PMID: 39125691 Free PMC article.
-
Tetraploidy-Associated Genetic Heterogeneity Confers Chemo-Radiotherapy Resistance to Colorectal Cancer Cells.Cancers (Basel). 2020 Apr 30;12(5):1118. doi: 10.3390/cancers12051118. Cancers (Basel). 2020. PMID: 32365785 Free PMC article.
References
-
- Beroukhim R., Mermel C. H., Porter D., Wei G., Raychaudhuri S., Donovan J., Barretina J., Boehm J. S., Dobson J., Urashima M., Mc Henry K. T., Pinchback R. M., Ligon A. H., Cho Y.-J., Haery L., Greulich H., Reich M., Winckler W., Lawrence M. S., Weir B. A., Tanaka K. E., Chiang D. Y., Bass A. J., Loo A., Hoffman C., Prensner J., Liefeld T., Gao Q., Yecies D., Signoretti S., Maher E., Kaye F. J., Sasaki H., Tepper J. E., Fletcher J. A., Tabernero J., Baselga J., Tsao M.-S., Demichelis F., Rubin M. A., Janne P. A., Daly M. J., Nucera C., Levine R. L., Ebert B. L., Gabriel S., Rustgi A. K., Antonescu C. R., Ladanyi M., Letai A., Garraway L. A., Loda M., Beer D. G., True L. D., Okamoto A., Pomeroy S. L., Singer S., Golub T. R., Lander E. S., Getz G., Sellers W. R., Meyerson M. (2010) The landscape of somatic copy-number alteration across human cancers. Nature 463, 899–905 - PMC - PubMed
-
- Storchova Z., Pellman D. (2004) From polyploidy to aneuploidy, genome instability and cancer. Nat. Rev. Mol. Cell Biol. 5, 45–54 - PubMed
-
- Lengauer C., Kinzler K. W., Vogelstein B. (1998) Genetic instabilities in human cancers. Nature 396, 643–649 - PubMed
-
- Nicholson J. M., Cimini D. (2011) How mitotic errors contribute to karyotypic diversity in cancer. Adv. Cancer Res. 112, 43–75 - PubMed
Publication types
MeSH terms
LinkOut - more resources
Full Text Sources
Other Literature Sources
Molecular Biology Databases
