. 2018 May;37(19):2515-2531.
doi: 10.1038/s41388-018-0136-0. Epub 2018 Feb 16.

Snail regulates BMP and TGFβ pathways to control the differentiation status of glioma-initiating cells

Affiliations

Snail regulates BMP and TGFβ pathways to control the differentiation status of glioma-initiating cells

Laia Caja et al. Oncogene. 2018 May.

Abstract

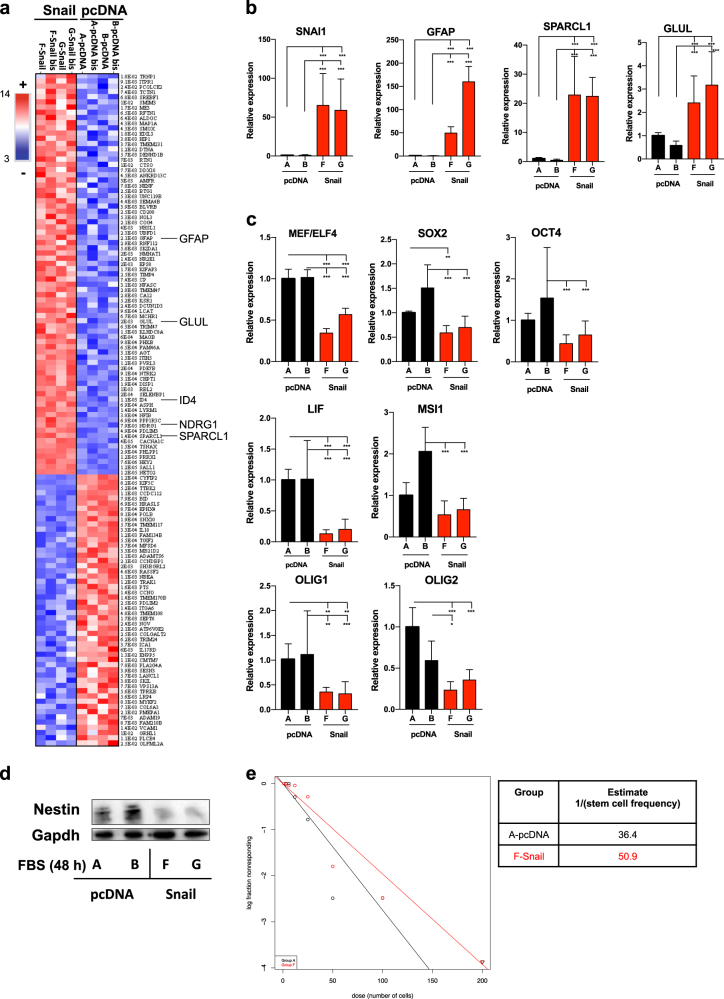
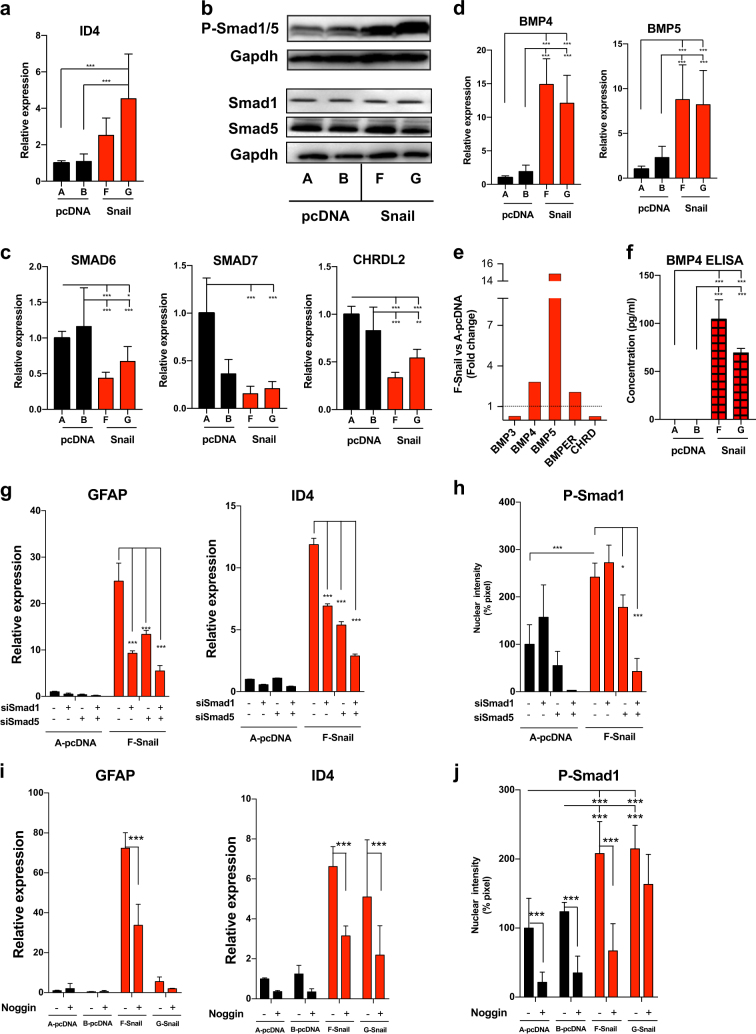
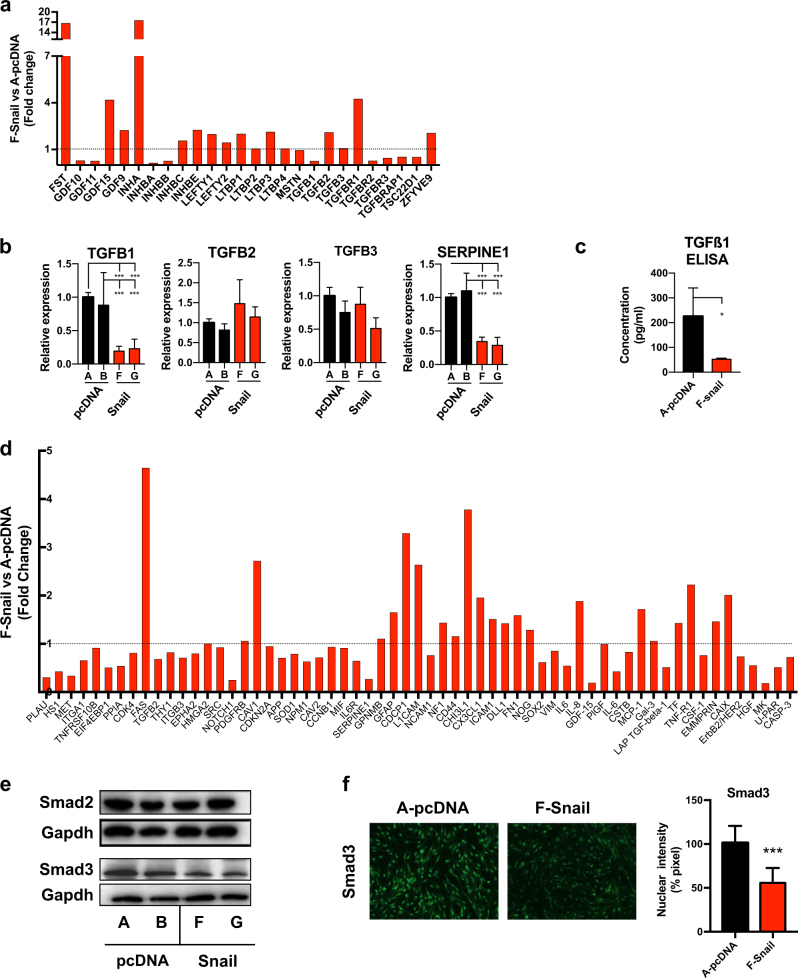
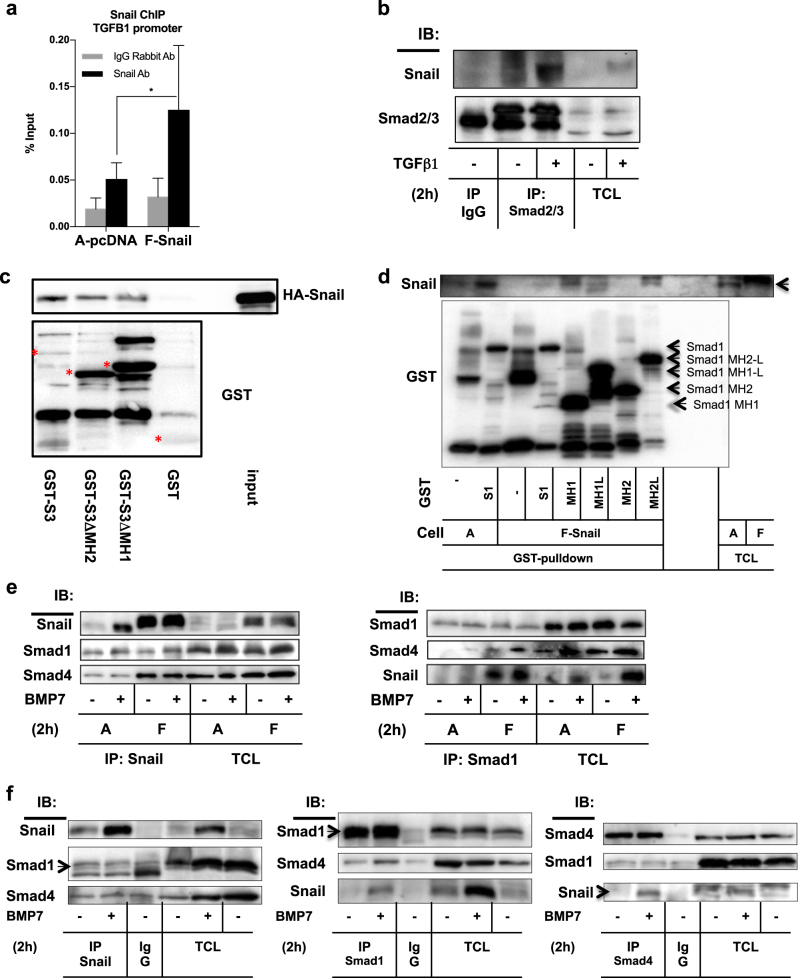
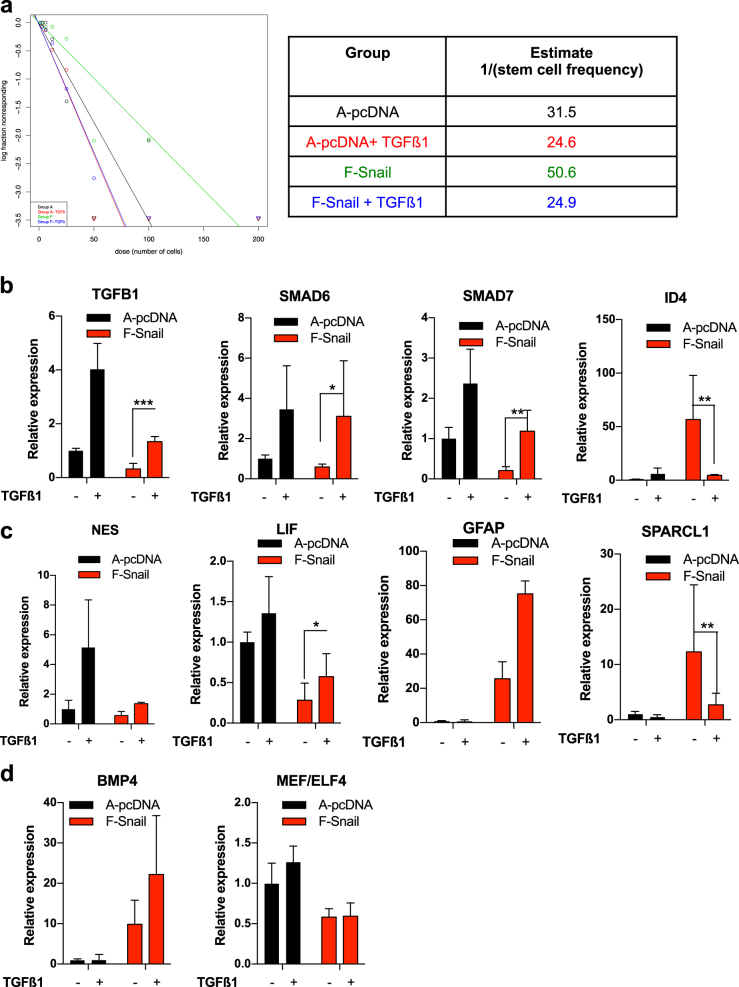
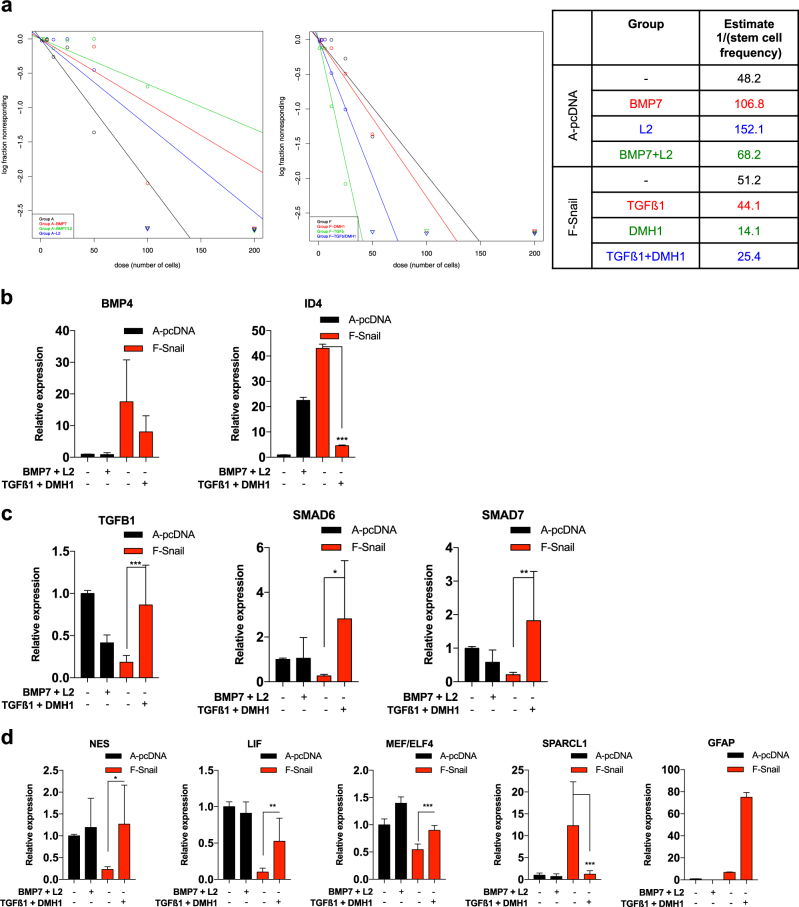
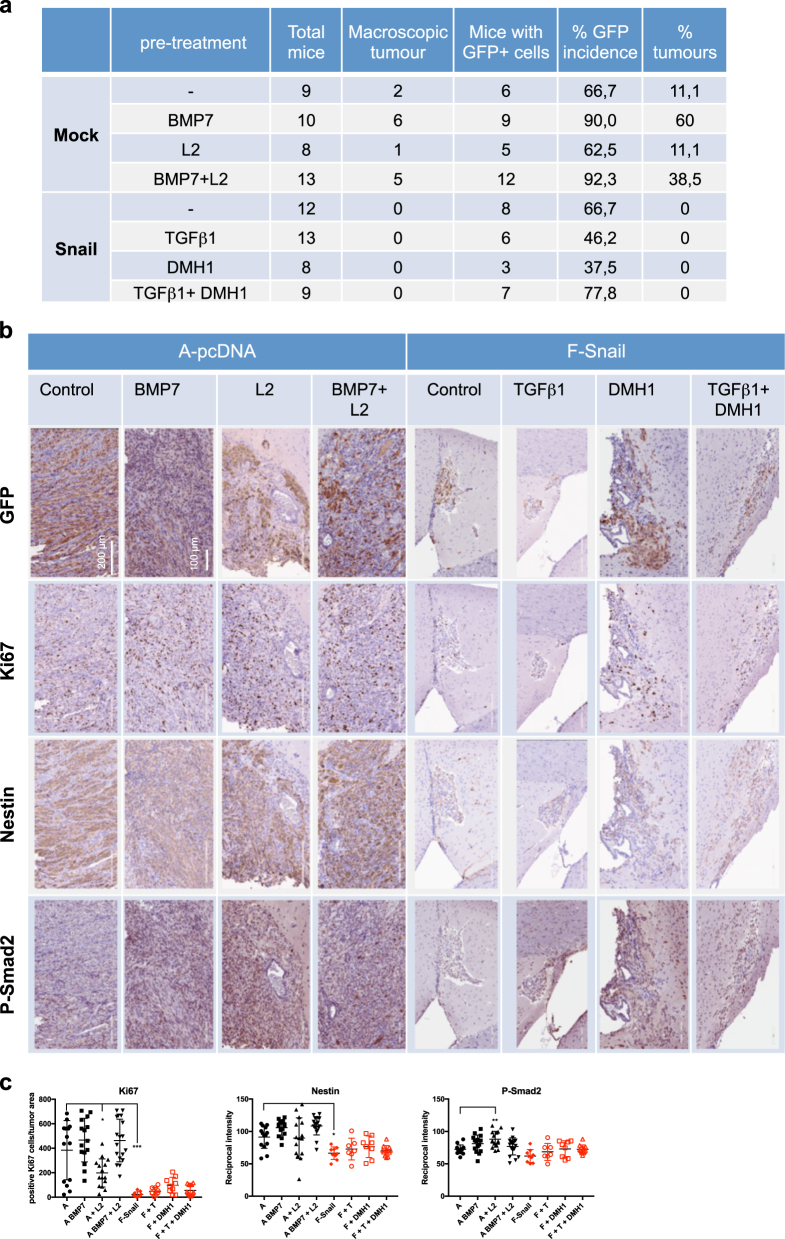
Glioblastoma multiforme is a brain malignancy characterized by high heterogeneity, invasiveness, and resistance to current therapies, attributes related to the occurrence of glioma stem cells (GSCs). Transforming growth factor β (TGFβ) promotes self-renewal and bone morphogenetic protein (BMP) induces differentiation of GSCs. BMP7 induces the transcription factor Snail to promote astrocytic differentiation in GSCs and suppress tumor growth in vivo. We demonstrate that Snail represses stemness in GSCs. Snail interacts with SMAD signaling mediators, generates a positive feedback loop of BMP signaling and transcriptionally represses the TGFB1 gene, decreasing TGFβ1 signaling activity. Exogenous TGFβ1 counteracts Snail function in vitro, and in vivo promotes proliferation and re-expression of Nestin, confirming the importance of TGFB1 gene repression by Snail. In conclusion, novel insight highlights mechanisms whereby Snail differentially regulates the activity of the opposing BMP and TGFβ pathways, thus promoting an astrocytic fate switch and repressing stemness in GSCs.


Conflict of interest statement

The authors declare that they have no competing interests.

Figures

Fig. 1
Fig. 1
Snail promotes astrocytic fate switch and impairs self-renewal capacity in GSCs. a Subgroup of genome-wide mRNA expression in U2987MG-Snail (clones F and G) or U2987MG-mock cells (pcDNA3 clones A and B). A heatmap displays differentially expressed genes, common between astrocytes (Cahoy et al. [20]) and U2987MG-Snail clones. Upregulated (red) and downregulated (blue) genes are listed; relevant genes are highlighted. b, c qRT-PCR analysis of mRNA expression (n = 3–6, technical triplicate) presented as mean ± SD. Statistical comparison (one-way Anova) indicates significant differences at: *p < 0.05, **p < 0.01, ***p < 0.001. d Nestin immunoblot with loading control (Gapdh) in cells cultured in complete (FBS) media for 48 h. e ELDA of U2987MG cells (A-pcDNA3, black symbols and F-Snail, red symbols) cultured for 10 days (n = 2, technical octaplicates). The number of wells containing spheres for each plating density is plotted. Steeper slopes indicate higher frequencies of sphere-forming cells. A table indicates average stem cell frequency per cell group
Fig. 2
Fig. 2
Snail expression in GBMs induces BMP signaling, promoting the astrocytic fate switch. U2987MG cells expressing pcDNA3-Snail (clones F and G) or empty vector (clones A and B). a, c, d qRT-PCR analysis of mRNA expression (n = 3, technical triplicate). b Immunoblot analysis for the indicated proteins and loading control Gapdh. Representative experiment out of three. e TGFβ family-related gene expression analyzed by Taqman array is graphed as fold-change of expression in F-Snail versus A-pcDNA cells. A horizontal dotted line indicates the onefold baseline (no change). f Human BMP4 protein levels in conditioned media determined by ELISA (n = 2, technical duplicate). g, h Cells were transiently transfected with siControl (−), siSMAD1 and/or siSMAD5 (+) siRNAs; g qRT-PCR analysis of mRNA expression (n = 2, technical triplicate), h quantification of nuclear pSmad1 staining. i, j Cells treated with or without Noggin (0.25 µg/ml) for 48 h; i qRT-PCR analysis of mRNA expression (n = 2, technical triplicate), j quantification of nuclear pSmad1 staining. Results are expressed as mean ± SD. Statistical comparison (one-way Anova for a, c, d, e; two-way Anova for gj) indicates significant differences at: *p < 0.05, **p < 0.01, ***p < 0.001
Fig. 3
Fig. 3
Snail suppresses TGFβ1 signaling. TGFβ family analysis in U2987MG cells expressing pcDNA3-Snail (clones F and G) or the empty vector (clones A and B). a TGFβ family-related gene expression analyzed by Taqman array is graphed as fold-change of expression in F-Snail versus A-pcDNA cells. A horizontal dotted line indicates the onefold baseline (no change). b qRT-PCR analysis of mRNA expression (n = 3, technical triplicate). c Human TGFβ1 protein levels in conditioned media determined by ELISA (n = 2, technical duplicate). d Protein expression analysis of secreted EVs by multiplex PEA graphed as fold-change in F-Snail versus A-pcDNA cells. A horizontal dotted line indicates onefold baseline (no change). e Immunoblot analysis of the indicated proteins and Gapdh (representative experiment). f Immunofluorescence staining of SMAD3 (left) and quantification of nuclear SMAD3 staining (right). Results expressed as mean ± SD. Statistical comparison (one-way Anova) indicates significant differences at: *p < 0.05, ***p < 0.001
Fig. 4
Fig. 4
Snail forms complexes with SMADs. a Snail ChIP on the TGFB1 promoter in U2987MG cells expressing pcDNA3-Snail (clone F) or the empty vector (clone A) (n = 3, technical triplicate). Results expressed as mean ± SD. Statistical comparison (Student’s t-test) indicates significant differences at: *p<0.05. Rabbit IgG control immunoprecipitation is shown. b Immunoprecipitation of endogenous SMAD2/3 followed by immunoblotting for Snail and SMAD2/3 in U2987MG cells stimulated with vehicle (–) or with 5 ng/ml TGFβ1 for 2 h (+). Negative control immunoprecipitation using non-specific IgG and endogenous total cell lysate (TCL) protein levels before immunoprecipitation are shown. c Pulldown assay of 293T cell extracts expressing pcDNA3-HA-Snail, loaded on purified GST or deletion mutants of GST-SMAD3, followed by GST and HA immunoblotting. Stars show specific SMAD3 constructs and input shows HA-Snail levels prior to pulldown. d Pulldown assay of U2987MG cell extracts expressing pcDNA3-Snail (clone F) or empty vector (clone A), loaded on purified GST or deletion mutants of GST-SMAD1, followed by GST and Snail immunoblotting. Arrows show each SMAD1 construct. TCL shows endogenous protein levels before pulldown. e U2987MG cells expressing pcDNA3-Snail (clone F) or empty vector (clone A) stimulated with vehicle (–) or 30 ng/ml BMP7 for 2 h (+); (left) Snail immunoprecipitation followed by Snail, SMAD1, and SMAD4 immunoblotting, (right) SMAD1 immunoprecipitation followed by Snail, SMAD1, and SMAD4 immunoblotting. TCL shows endogenous protein levels before immunoprecipitation. f U2987MG cells stimulated with vehicle (−BMP7) or 30 ng/ml BMP7 for 2 h. Immunoprecipitation of Snail (left), SMAD1 (middle), and SMAD4 (right) followed by Snail, SMAD1, and SMAD4 immunoblotting. Negative control immunoprecipitation using non-specific IgG is shown. TCL shows the levels of endogenous proteins before immunoprecipitation
Fig. 5
Fig. 5
TGFβ1 restores stem-like growth in GSCs expressing Snail. a ELDA of U2987MG cells (A-pcDNA and F-Snail) plated in decreasing numbers (200–1 (cell/s)/well) in the presence or absence of 5 ng/ml TGFβ1 for 10 days (n = 2, technical octaplicate). Steeper slopes indicate higher frequencies of colony-forming cells. A table indicates average stem cell frequency for each group. bd qRT-PCR analysis of mRNA expression in cells stimulated with or without 5 ng/ml TGFβ1 for 72 h (n = 3, technical triplicate). Results are expressed as mean ± SD. Statistical comparison (two-way Anova) indicates significant differences at: *p < 0.05, **p < 0.01, ***p < 0.001
Fig. 6
Fig. 6
BMP7 and TGFβ inhibitor co-treatment partially phenocopies Snail function in GSCs. a ELDA of U2987MG cells (A-pcDNA and F-Snail) plated in decreasing numbers (200–1 (cell/s)/well). A-pcDNA3 cells were treated with or without 30 ng/ml BMP7 in the presence or absence of TGFβ inhibitor LY2157299 (L2, 2 µM). F-Snail cells were treated with or without 5 ng/ml TGFβ1 in the presence or absence of DMH1 (0.5 µM). Spheres were counted on day 10 (n = 2, technical octaplicate); steeper slopes indicate higher frequencies of colony-forming cells. The table indicates average stem cell frequency for each group. bd qRT-PCR analysis of mRNA expression in A-pcDNA cells treated with BMP7 (30 ng/ml) and TGFβ inhibitor (L2, 2 µM) and in F cells treated with TGFβ1 (5 ng/ml) and BMP inhibitor (DMH1, 0.5 µM) for 72 h (n = 2, technical triplicate). Results are expressed as mean ± SD. Statistical comparison (one-way Anova) indicates significant differences at: *p < 0.05, **p < 0.01, ***p < 0.001
Fig. 7
Fig. 7
Snail suppresses GBM in vivo. a Tumor formation in orthotopically xenografted immunodeficient mice. b Immunohistochemistry of GFP, Ki67, Nestin, and phospho-SMAD2. c Immunohistochemistry quantification: (left) % Ki67-positive nuclei expressed as a percentage of tumor area; (center and right) reciprocal intensity of Nestin and phosho-SMAD2. Data show mean ± SD of 9–20 fields of 3 mice. Statistical comparison (one-way Anova) indicates significant differences at: *p < 0.05, **p < 0.01, ***p < 0.001

Similar articles

Cited by

References

    1. Yan K, Yang K, Rich JN. The evolving landscape of glioblastoma stem cells. Curr Opin Neurol. 2013;26:701–7. doi: 10.1097/WCO.0000000000000032. - DOI - PMC - PubMed
    1. Bonavia R, Inda MM, Cavenee WK, Furnari FB. Heterogeneity maintenance in glioblastoma: a social network. Cancer Res. 2011;71:4055–60. doi: 10.1158/0008-5472.CAN-11-0153. - DOI - PMC - PubMed
    1. Haar CP, Hebbar P, Wallace GC, Das A, Vandergrift WA, Smith JA, et al. Drug resistance in glioblastoma: a mini review. Neurochem Res. 2012;37:1192–200. doi: 10.1007/s11064-011-0701-1. - DOI - PMC - PubMed
    1. Chen J, Li Y, Yu TSS, McKay RM, Burns DK, Kernie SG, et al. A restricted cell population propagates glioblastoma growth after chemotherapy. Nature. 2012;488:522–6. doi: 10.1038/nature11287. - DOI - PMC - PubMed
    1. Ming GL, Song H. Adult neurogenesis in the mammalian brain: significant answers and significant questions. Neuron. 2011;70:687–702. doi: 10.1016/j.neuron.2011.05.001. - DOI - PMC - PubMed

Publication types

MeSH terms

Substances