Initiating Events in Direct Cardiomyocyte Reprogramming
- PMID: 29444441
- PMCID: PMC6045814
- DOI: 10.1016/j.celrep.2018.01.047
Initiating Events in Direct Cardiomyocyte Reprogramming
Abstract
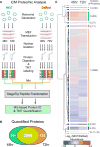
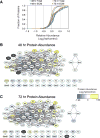
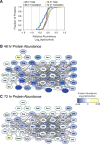
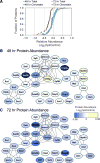
Direct reprogramming of fibroblasts into cardiomyocyte-like cells (iCM) holds great potential for heart regeneration and disease modeling and may lead to future therapeutic applications. Currently, application of this technology is limited by our lack of understanding of the molecular mechanisms that drive direct iCM reprogramming. Using a quantitative mass spectrometry-based proteomic approach, we identified the temporal global changes in protein abundance that occur during initial phases of iCM reprogramming. Collectively, our results show systematic and temporally distinct alterations in levels of specific functional classes of proteins during the initiating steps of reprogramming including extracellular matrix proteins, translation factors, and chromatin-binding proteins. We have constructed protein relational networks associated with the initial transition of a fibroblast into an iCM. These findings demonstrate the presence of an orchestrated series of temporal steps associated with dynamic changes in protein abundance in a defined group of protein pathways during the initiating events of direct reprogramming.
Keywords: cardiac; direct reprogramming; heart; iCM; induced cardiomyocytes; quantitative mass spectrometry.
Copyright © 2018 The Author(s). Published by Elsevier Inc. All rights reserved.
Conflict of interest statement
The authors declare no competing interests.
Figures


Similar articles
-
Re-patterning of H3K27me3, H3K4me3 and DNA methylation during fibroblast conversion into induced cardiomyocytes.Stem Cell Res. 2016 Mar;16(2):507-18. doi: 10.1016/j.scr.2016.02.037. Epub 2016 Feb 27. Stem Cell Res. 2016. PMID: 26957038 Free PMC article.
-
Single-cell transcriptomics reconstructs fate conversion from fibroblast to cardiomyocyte.Nature. 2017 Nov 2;551(7678):100-104. doi: 10.1038/nature24454. Epub 2017 Oct 25. Nature. 2017. PMID: 29072293 Free PMC article.
-
Direct Cardiac Reprogramming as a Novel Therapeutic Strategy for Treatment of Myocardial Infarction.Methods Mol Biol. 2017;1521:69-88. doi: 10.1007/978-1-4939-6588-5_5. Methods Mol Biol. 2017. PMID: 27910042 Free PMC article.
-
Reprogramming of Non-myocytes into Cardiomyocyte-like Cells: Challenges and Opportunities.Curr Cardiol Rep. 2020 Jun 19;22(8):54. doi: 10.1007/s11886-020-01322-0. Curr Cardiol Rep. 2020. PMID: 32562156 Review.
-
Direct reprogramming of fibroblasts into cardiomyocytes.Stem Cell Res Ther. 2017 May 25;8(1):118. doi: 10.1186/s13287-017-0569-3. Stem Cell Res Ther. 2017. PMID: 28545505 Free PMC article. Review.
Cited by
-
Cardiac Tissue-like 3D Microenvironment Enhances Route towards Human Fibroblast Direct Reprogramming into Induced Cardiomyocytes by microRNAs.Cells. 2022 Feb 25;11(5):800. doi: 10.3390/cells11050800. Cells. 2022. PMID: 35269422 Free PMC article.
-
Recent advances and future prospects in direct cardiac reprogramming.Nat Cardiovasc Res. 2023 Dec;2(12):1148-1158. doi: 10.1038/s44161-023-00377-w. Epub 2023 Dec 11. Nat Cardiovasc Res. 2023. PMID: 39196156 Review.
-
Direct Cardiac Reprogramming: A Novel Approach for Heart Regeneration.Int J Mol Sci. 2018 Sep 5;19(9):2629. doi: 10.3390/ijms19092629. Int J Mol Sci. 2018. PMID: 30189626 Free PMC article. Review.
-
Transdifferentiation: do transition states lie on the path of development?Curr Opin Syst Biol. 2018 Oct;11:18-23. doi: 10.1016/j.coisb.2018.07.004. Curr Opin Syst Biol. 2018. PMID: 30386832 Free PMC article. Review.
-
Cardiomyocyte precursors generated by direct reprogramming and molecular beacon selection attenuate ventricular remodeling after experimental myocardial infarction.Stem Cell Res Ther. 2023 Oct 15;14(1):296. doi: 10.1186/s13287-023-03519-w. Stem Cell Res Ther. 2023. PMID: 37840130 Free PMC article.
References
-
- Bonaldi T, Straub T, Cox J, Kumar C, Becker PB, Mann M. Combined use of RNAi and quantitative proteomics to study gene function in Drosophila. Mol Cell. 2008;31:762–772. - PubMed
-
- Chakraborty S, Njah K, Pobbati AV, Lim YB, Raju A, Lakshmanan M, Tergaonkar V, Lim CT, Hong W. Agrin as a mechanotransduction signal regulating YAP through the hippo pathway. Cell Rep. 2017;18:2464–2479. - PubMed
Publication types
MeSH terms
Substances
Grants and funding
LinkOut - more resources
Full Text Sources
Other Literature Sources
Molecular Biology Databases
Research Materials

