. 2018 Apr 16;38(9):e00047-18.
doi: 10.1128/MCB.00047-18. Print 2018 May 1.

Asp1 Bifunctional Activity Modulates Spindle Function via Controlling Cellular Inositol Pyrophosphate Levels in Schizosaccharomyces pombe

Affiliations

Asp1 Bifunctional Activity Modulates Spindle Function via Controlling Cellular Inositol Pyrophosphate Levels in Schizosaccharomyces pombe

Marina Pascual-Ortiz et al. Mol Cell Biol. .

Abstract

The generation of two daughter cells with the same genetic information requires error-free chromosome segregation during mitosis. Chromosome transmission fidelity is dependent on spindle structure/function, which requires Asp1 in the fission yeast Schizosaccharomyces pombe Asp1 belongs to the diphosphoinositol pentakisphosphate kinase (PPIP5K)/Vip1 family which generates high-energy inositol pyrophosphate (IPP) molecules. Here, we show that Asp1 is a bifunctional enzyme in vivo: Asp1 kinase generates specific IPPs which are the substrates of the Asp1 pyrophosphatase. Intracellular levels of these IPPs directly correlate with microtubule stability: pyrophosphatase loss-of-function mutants raised Asp1-made IPP levels 2-fold, thus increasing microtubule stability, while overexpression of the pyrophosphatase decreased microtubule stability. Absence of Asp1-generated IPPs resulted in an aberrant, increased spindle association of the S. pombe kinesin-5 family member Cut7, which led to spindle collapse. Thus, chromosome transmission is controlled via intracellular IPP levels. Intriguingly, identification of the mitochondrion-associated Met10 protein as the first pyrophosphatase inhibitor revealed that IPPs also regulate mitochondrial distribution.

Keywords: PPIP5K family; Schizosaccharomyces pombe; chromosome segregation; inositol pyrophosphate; microtubule; mitosis; phosphatase; signaling molecules; yeast.


Figures

FIG 1
FIG 1
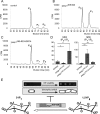
Asp1 kinase generates IP8. (A to C) HPLC elution profiles of inositol polyphosphates of wild-type (WT), asp1D333A, and asp1Δ strains. S. pombe cells were radiolabeled with [3H]inositol, and cell lysates were separated using anion-exchange HPLC. CPM, counts per minute. (D) Diagrammatic representations of IP8 levels relative to those of IP6 and IP7 levels relative to those of IP6 (WT, n = 3; asp1D333A strain, n = 2; asp1Δ strain, n = 3; ***, P ≤ 0.001; *, P ≤ 0.05, t test). The fold change of IP8/IP6 is as follows (WT set at 1.00): 0.12 for the asp1D333A strain and 0.11 for the asp1Δ strain. Fold changes of IP7/IP6 are as follows: 6.26 for the asp1D333A strain and 4.56 for the asp1Δ strain. n, number of experiments done.
FIG 2
FIG 2
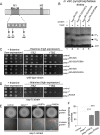
In vivo analysis of Asp1365–920 and Asp1365–920/H397A function. (A) Diagrammatic representation of the dual-domain structure of Asp1 with kinase (K) and pyrophosphatase (P, light gray box) regions. An enlargement of pyrophosphatase domain with the signature motifs M1 and M2 of histidine acid phosphatases is shown (1). In Asp1, the aspartate residue of M2 is replaced by isoleucine (HI instead of HD). (B) Serial dilution patch tests (104 to 101 cells) of a wild-type strain transformed with vector (control) or plasmids expressing asp1365–920 or asp1365–920/H397A from the thiamine-repressible promoter nmt1+. Transformants were grown under plasmid-selective conditions in the absence or presence of 7 μg/ml TBZ at 25°C for 7 days. (C) Invasive-growth assay. A total of 105 wild-type cells transformed with either a vector control or a plasmid expressing asp1365–920 or asp1365–920/H397A were spotted on plasmid-selective medium without thiamine and incubated for 21 days at 30°C (surface growth). Plates were washed, and all surface growth was rubbed off. Invasively growing colonies remained (bottom panels) and were counted. In the quantification shown on the right, three transformants were analyzed per plasmid in triplicate; ns, not significant; ***, P < 0.0005, t test. The numbers of agar-invading colonies of the asp1365–920/H397A transformants and the control transformants were 16.5 ± 4.0 and 17.5 ± 3.6, respectively.
FIG 3
FIG 3
Asp1365–920 has pyrophosphatase activity in vivo. (A to C) HPLC elution profiles of inositol polyphosphates of the wild-type strain transformed with a vector control (A) or asp1365–920- or asp1365–920/H397A-expressing plasmids (B and C, respectively). Cells were radiolabeled with [3H]inositol, and cell lysates were separated using anion-exchange HPLC. (D) Diagrammatic representation of IP8 levels relative to those of IP6 and IP7 levels relative to those of IP6 normalized to values for the vector control using data from panels A to C (control, n = 4; pasp1365–920 strain, n = 4; pasp1365–920/H397A strain, n = 4; **, P ≤ 0.01; *, P ≤ 0.05; ns, not significant, t test). The fold change of IP8/IP6 is as follows (control set at 1.00): 0.4 for the pasp1365–920 strain and 5.3 for the pasp1365–920/H397A strain. Fold changes of IP7/IP6 are as follows: 9.3 for the pasp1365–920 strain and 1.8 for the pasp1365–920/H397A strain. (E) MT stability and the dimorphic switch require intracellular IP8, which is downregulated by Asp1 pyrophosphatase activity.
FIG 4
FIG 4
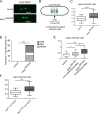
IP8 controls Cut7-GFP spindle association. (A) Photomicrographs of cut7+-GFP cells transformed with a vector control or an asp1365–920-expressing plasmid. Scale bars, 2 μm. (B) Quantification of the fluorescence signal of Cut7-GFP on short spindles. For comparison of the signal intensity at the spindle midzone to that at the spindle ends, the fluorescence signal at the midzone was normalized against the background (square 5 − square 6) and divided by the fluorescence intensity at spindle ends (square 1 − square 2 plus square 3 − square 4). (C) Diagrammatic representation of the ratio of the spindle midzone/spindle ends (control, n = 29; pasp1365–920 strain, n = 24; ***, P ≤ 0.001, t test; significant outliers were removed using Grubbs' test). (D) Diagrammatic representation of the frequency of spindle breaks in the indicated transformants (control, n = 30; pasp1365–920 strain, n = 29; ***, P ≤ 0.001, χ2 test). (E) Diagrammatic representation of the ratios of the spindle midzone/spindle ends (control, n = 30; pasp1365–920 strain [nonbreaking spindles], n = 23; pasp1365–920 strain [breaking spindles], n = 17 [9 cells]; *, P ≤ 0.05; ***, P ≤ 0.001, t test). (F) Diagrammatic representation of the ratios spindle midzone/spindle ends (asp1+ cut7-GFP strain, n = 29; asp1D333A cut7-GFP strain, n = 24; ***, P ≤ 0.001, t test; significant outliers were removed using Grubbs' test). Analysis was carried out at 33°C.
FIG 5
FIG 5
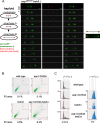
asp1D333A cell population contains polyploid cells. (A) Photomicrographs of a mitotic asp1D333A bub3Δ cell expressing sad1+-mCherry and cen1-GFP. Time between images, 1 min; scale bar, 2 μm. Two of 11 analyzed asp1D333A bub3Δ double mutant cells showed this phenotype. (B) FACS analysis of the indicated strains. Cells were gated for size, revealing that cell populations with an asp1D333A strain background were much more heterogenous than asp1+ populations. The P2 area contains the largest cells. (C) Measurement of DNA content (2N to 32N) of the entire cell population and the P2 population. DNA content of peaks was defined by using the cdc11-123 strain as a standard (see Fig. S5 in the supplemental material) (65).
FIG 6
FIG 6
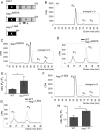
Loss of a functional Asp1 pyrophosphatase domain results in increased IP8 levels. (A) Diagrammatic representation of Asp1 variants analyzed. All variants were expressed from the endogenous asp1+ locus. (B and C) HPLC elution profiles of inositol polyphosphates of the wild-type type (WT) and asp1H397A strains. (D) Comparison of part of the inositol pyrophosphate profiles of the wild-type and asp1H397A strains. (E) Diagrammatic representation of IP8 levels relative to those of IP7 (WT, n = 4; asp1H397A strain, n = 3; *, P ≤ 0.05, t test). The fold change of IP8/IP7 is 2.81 for the asp1H397A strain relative to the level of the wild-type strain. (F) HPLC elution profile of inositol polyphosphates of the asp11364 strain. (G) Comparison of inositol pyrophosphate profiles of the wild-type and asp11364 strains (data used for this wild-type strain were obtained from a strain grown in parallel to the asp11364 strain). (H) Diagrammatic representation of IP8 levels relative to those of IP7 and normalized to the wild-type level (WT, n = 4; asp11–364 strain, n = 3; **, P ≤ 0.01, t test). The fold change of IP8/IP7 is 1.67 for the asp11364 strain relative to the level of the wild-type strain.
FIG 7
FIG 7
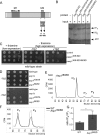
The conserved amino acids of the M1 motif are essential for pyrophosphatase activity. (A) Diagrammatic representation of Asp1 pyrophosphatase M1 motif mutants. (B) In vitro pyrophosphatase assay using Asp1365–920, Asp1365–920/H397A, Asp1365–920/R400A, or Asp1365–920/R396A. Eight micrograms of the indicated proteins was added to Asp1 kinase-generated IP7 (input is shown in lane 1) and incubated for 16 h, and the resulting inositol polyphosphates were resolved on a 35.5% PAGE gel and stained with toluidine blue (−, without added component; +, with added component). All pyrophosphatase variants were tested at least twice in the in vitro assay. (C) Serial dilution patch tests (104 to 101 cells) of a wild-type strain transformed with vector (control) or plasmids expressing the indicated asp1 variants via the nmt1+ promoter. Transformants were grown under plasmid-selective conditions with or without thiamine and with or without 7 μg/ml TBZ at 25°C for 7 days. (D) Serial dilution patch tests (104 to 101 cells) of an asp1Δ strain transformed with vector (control) or plasmids expressing asp1+ or asp1R400A from the nmt1+ promoter. Transformants were grown as described for panel C. (E) Invasive-growth assay. A total of 105 asp1Δ cells transformed with a vector control or plasmid expressing asp1+, asp1H397A, or asp1R400A were grown on plasmid-selective thiamine-supplemented medium for 21 days at 30°C (surface growth). Removal of surface growth by washing revealed invasively growing colonies (bottom panels). (F) Quantification of invasively growing colonies. Per plasmid, three transformants were analyzed in triplicate. ***, P < 0.0005, t test. Numbers of invasive colonies: 81 ± 6 for the asp1H397A strain and 113 ± 8 for the asp1R400A strain.
FIG 8
FIG 8
The I808D mutation abolishes Asp1 pyrophosphatase activity. (A) Diagrammatic representation of M2 motif mutants. (B) In vitro pyrophosphatase assay using 8 μg of protein of the indicated Asp1 variants. The assay was performed as described in the legend to Fig. 7B. The pyrophosphatase variants were tested at least twice in the in vitro assay. (C) Serial dilution patch tests (104 to 101 cells) of a wild-type strain transformed with a vector (control) or plasmid expressing asp1365–920 or asp1365–920/I808D via nmt1+. Transformants were grown under plasmid-selective conditions with or without thiamine and with or without 7 μg/ml TBZ at 25°C for 7 days. (D) Serial dilution patch tests (104 to 101 cells) of the wild-type, asp1Δ, asp1H397A, and asp1I808D strains grown on YE5S full medium at 25°C for 5 days with or without 12 μg/ml TBZ. (E) HPLC elution profile of inositol polyphosphates of the asp1I808D strain. (F) Comparison of inositol pyrophosphate profiles of wild-type and asp1I808D strains. (G) IP8 levels relative to those of IP7 and normalized to the wild-type level from data shown in panel F (WT, n = 4; asp1I808D strain, n = 3; *, P ≤ 0.05, t test). The fold change of IP8/IP7 is 2 for the asp1I808D strain compared to the level of the wild-type strain.
FIG 9
FIG 9
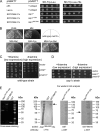
Characterization of the Asp1 interaction partner Met10. (A) Yeast two-hybrid analysis of the interaction between Asp1 and Met10 (SPCC584.01c). S. cerevisiae strain AH109 was cotransformed with a plasmid expressing asp1+ fused to the GAL4 binding domain (pGBKT7) and a plasmid expressing an met10 variant (amino acids 544 to 1006) fused to the GAL4 activation domain (pGADT7). Cells were spotted on plasmid-selective SD medium with or without histidine and incubated for 5 days at 30°C. (B) Growth of wild-type and met10Δ strains on the indicated medium: full medium (YE5S), minimal medium (MM), MM plus 330 μM cysteine (MM+Cys), MM plus 140 μM methionine (MM+Met), or MM plus cysteine and methionine (MM+Cys+Met). (C) Serial dilution patch tests (104 to 101 cells) of a wild-type strain transformed with a vector (control) or plasmid expressing asp1+ or met10+ from the nmt1+ promoter. Transformants were grown at 25°C for 8 days. (D) Serial dilution patch tests (104 to 101 cells) of transformed asp1Δ cells with a vector (control) or plasmid expressing asp1+ or met10+ via nmt1+. Incubation was performed at 25°C for 11 days. (E) Far-Western analysis. A Coomassie-stained gel of 1 μg of the indicated purified proteins on the far left. Blots, from left to right, show the following: protein-protein interaction of GST-Met10 (blotted protein; 138 kDa, arrow) and Asp1365–920-His (probe protein) using His antibody for detection of GST-Met10; interaction of Asp1365–920-His (blotted protein) and GST (probe protein) with a GST antibody (control); protein-protein interaction of Asp1365–920-His (blotted protein; 65 kDa, arrow) and GST-Met10 (probe protein) using GST antibody for detection of Asp1365–920-His. One microgram of protein was loaded on the gel in all cases. Concentration of probe proteins, 10 μg/ml.
FIG 10
FIG 10
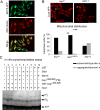
The mitochondrion-associated Met10 protein inhibits Asp1 pyrophosphatase activity in vitro. (A) Live-cell imaging of Met10-GFP cells stained with MitoTracker. Shown are maximum-intensity projection images of interphase cells grown at 25°C. Bars, 10 μm. (B) Live-cell imaging of the mitochondrial protein Cox4-RFP in asp1+ or asp1Δ cells was performed (top). Shown are maximum-intensity projection images of interphase cells grown at 25°C (#, normal mitochondrial distribution; *, abnormal mitochondrial distribution). Bars, 10 μm. Mitochondrial distribution is quantified in the graph: asp1+ strain, n = 143; asp1H397A strain, n = 77; asp1Δ strain, n = 44; **, P < 0.01; ***, P < 0.001, χ2 test). (C) In vitro pyrophosphatase assay. Lanes 1 and 8, input controls; lane 2, 4 μg of GST-Asp1365–920; lane 3, 4 μg of GST-Asp1365–920 plus 6 μg of Met10; lane 4, 4 μg of Asp365–920-His; lane 5, 4 μg of Asp365–920-His plus 8 μg of Met10; lane 6, 2 μg of Ddp1-GST; lane 7, 2 μg of Ddp1-GST plus 6 μg of Met10; lane 9, 2 μg of GST; lane 10, 6 μg of GST-Met10 and 2 μg of GST. In vitro pyrophosphatase assays involving Met10 protein were repeated four times. All assay mixtures were incubated for 16 h, and the resulting inositol polyphosphates were resolved by 35.5% PAGE and stained with toluidine blue (−, without added component; +, with added component). Sizes of proteins used for the experiment shown in panel C are as follows: GST-Asp1365–920, ∼91 kDa; GST-Met10, ∼138 kDa; Asp1365–920-His, ∼66 kDa; GST-Ddp1, ∼48 kDa.

Similar articles

Cited by

References

    1. Fridy PC, Otto JC, Dollins DE, York JD. 2007. Cloning and characterization of two human VIP1-like inositol hexakisphosphate and diphosphoinositol pentakisphosphate kinases. J Biol Chem 282:30754–30762. doi:10.1074/jbc.M704656200. - DOI - PubMed
    1. Mulugu S, Bai W, Fridy PC, Bastidas RJ, Otto JC, Dollins DE, Haystead TA, Ribeiro AA, York JD. 2007. A conserved family of enzymes that phosphorylate inositol hexakisphosphate. Science 316:106–109. doi:10.1126/science.1139099. - DOI - PubMed
    1. Choi JH, Williams J, Cho J, Falck JR, Shears SB. 2007. Purification, sequencing, and molecular identification of a mammalian PP-InsP5 kinase that is activated when cells are exposed to hyperosmotic stress. J Biol Chem 282:30763–30775. doi:10.1074/jbc.M704655200. - DOI - PMC - PubMed
    1. Saiardi A, Resnick AC, Snowman AM, Wendland B, Snyder SH. 2005. Inositol pyrophosphates regulate cell death and telomere length through phosphoinositide 3-kinase-related protein kinases. Proc Natl Acad Sci U S A 102:1911–1914. doi:10.1073/pnas.0409322102. - DOI - PMC - PubMed
    1. York SJ, Armbruster BN, Greenwell P, Petes TD, York JD. 2005. Inositol diphosphate signaling regulates telomere length. J Biol Chem 280:4264–4269. doi:10.1074/jbc.M412070200. - DOI - PubMed

Publication types

MeSH terms

LinkOut - more resources