. 2018 Mar 7;38(10):2615-2630.
doi: 10.1523/JNEUROSCI.2282-17.2018. Epub 2018 Feb 7.

Overlapping Role of SCYL1 and SCYL3 in Maintaining Motor Neuron Viability

Affiliations

Overlapping Role of SCYL1 and SCYL3 in Maintaining Motor Neuron Viability

Emin Kuliyev et al. J Neurosci. .

Abstract

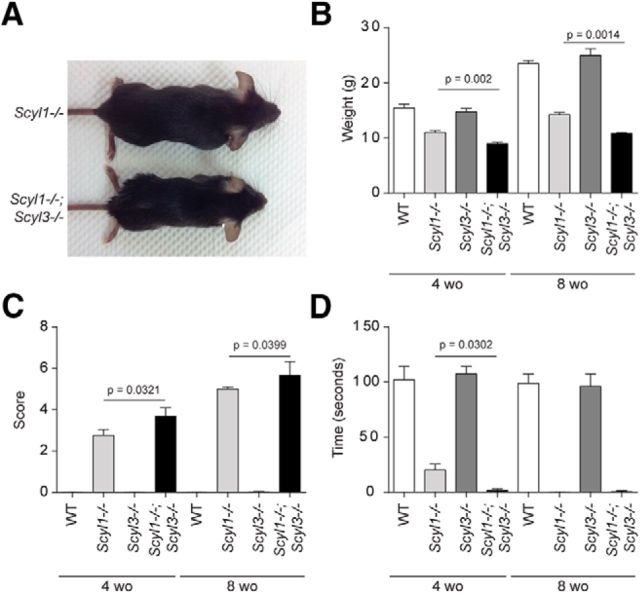
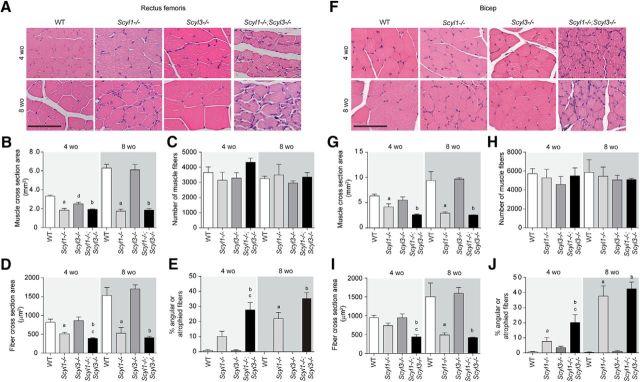
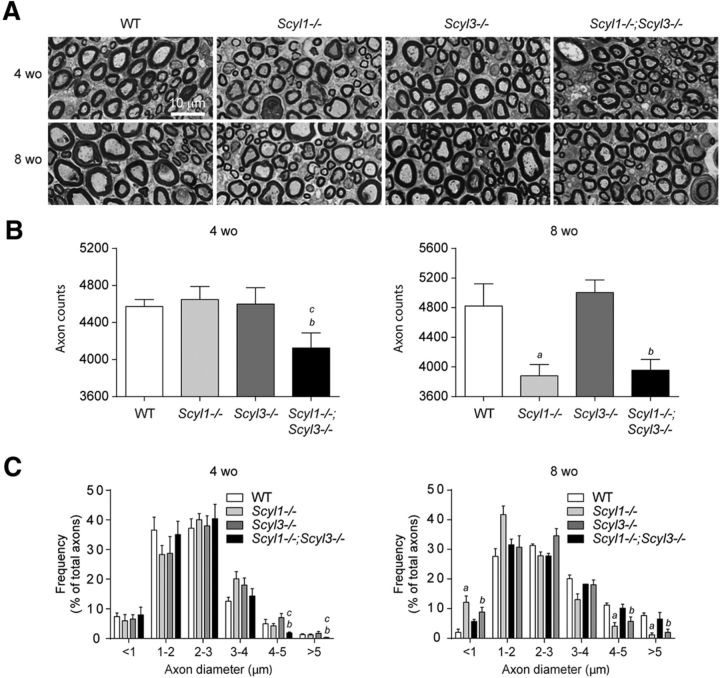
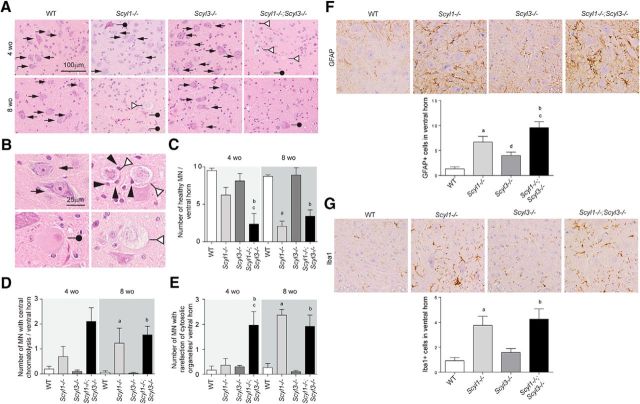
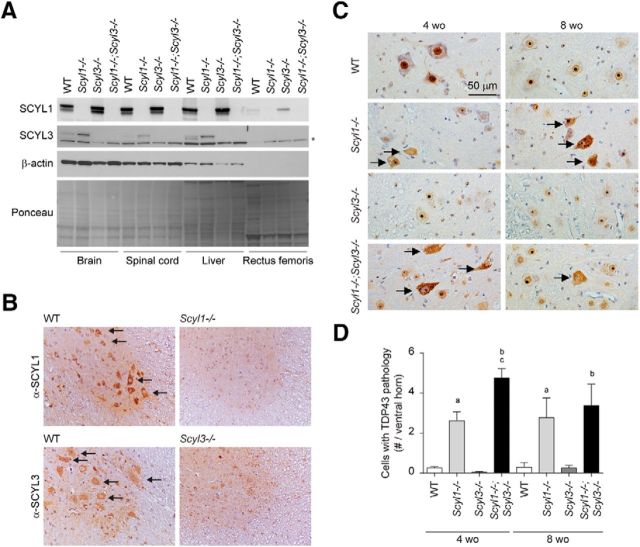
Members of the SCY1-like (SCYL) family of protein kinases are evolutionarily conserved and ubiquitously expressed proteins characterized by an N-terminal pseudokinase domain, centrally located Huntingtin, elongation factor 3, protein phosphatase 2A, yeast kinase TOR1 repeats, and an overall disorganized C-terminal segment. In mammals, three family members encoded by genes Scyl1, Scyl2, and Scyl3 have been described. Studies have pointed to a role for SCYL1 and SCYL2 in regulating neuronal function and viability in mice and humans, but little is known about the biological function of SCYL3. Here, we show that the biochemical and cell biological properties of SCYL3 are similar to those of SCYL1 and both proteins work in conjunction to maintain motor neuron viability. Specifically, although lack of Scyl3 in mice has no apparent effect on embryogenesis and postnatal life, it accelerates the onset of the motor neuron disorder caused by Scyl1 deficiency. Growth abnormalities, motor dysfunction, hindlimb paralysis, muscle wasting, neurogenic atrophy, motor neuron degeneration, and loss of large-caliber axons in peripheral nerves occurred at an earlier age in Scyl1/Scyl3 double-deficient mice than in Scyl1-deficient mice. Disease onset also correlated with the mislocalization of TDP-43 in spinal motor neurons, suggesting that SCYL1 and SCYL3 regulate TDP-43 proteostasis. Together, our results demonstrate an overlapping role for SCYL1 and SCYL3 in vivo and highlight the importance the SCYL family of proteins in regulating neuronal function and survival. Only male mice were used in this study.SIGNIFICANCE STATEMENT SCYL1 and SCYL2, members of the SCY1-like family of pseudokinases, have well established roles in neuronal function. Herein, we uncover the role of SCYL3 in maintaining motor neuron viability. Although targeted disruption of Scyl3 in mice had little or no effect on embryonic development and postnatal life, it accelerated disease onset associated with the loss of Scyl1, a novel motor neuron disease gene in humans. Scyl1 and Scyl3 double-deficient mice had neuronal defects characteristic of amyotrophic lateral sclerosis, including TDP-43 pathology, at an earlier age than did Scyl1-deficient mice. Thus, we show that SCYL1 and SCYL3 play overlapping roles in maintaining motor neuronal viability in vivo and confirm that SCYL family members are critical regulators of neuronal function and survival.

Keywords: CASP; COPI; SCYL1; SCYL3; TDP-43; motor neuron.


Figures

Figure 1.
Figure 1.
SCYL3 domain structure, distribution, and localization. A, Schematic representation of the SCYL family of protein pseudokinases and predicted domains. SCYL3, like SCYL1 and SCYL2, consists of an N-terminal pseudokinase domain, four HEAT repeats, and a C-terminal segment containing no known protein domain. B, Sequence identity among SCYL family members. The overall identity between SCYL1 and SCYL2 is 17%; between SCYL1 and SCYL3 is 19.7%; between SCYL2 and SCYL3 is 14%; and between SCYL2 and SCYL3 is 10.5%. C, Selectivity of antibodies against SCYL1, SCYL2, and SCYL3. NIH 3T3 cells were transfected with or without RNAi targeting Scyl1, Scyl2, or Scyl3 transcripts. Then, 48 h after transfection, protein extracts were analyzed by Western blot using antibodies against SCYL1, SCYL2, SCYL3, or μ2-adaptin as a loading control. *Indicates nonspecific band. D, Tissue distribution of SCYL proteins. Protein extracts prepared from various mouse tissues were resolved by SDS-PAGE and analyzed by Western blot, using antibodies against SCYL1, SCYL2, and SCYL3. E, Exponentially growing WT and Scyl3−/− MEFs were stained with anti-SCYL3 antibody and imaged by confocal microscopy. Note the presence of SCYL3-positive staining in the perinuclear region of WT (arrow) but not Scyl3−/− MEFs. *Indicates nonspecific nuclear staining in WT and Scyl3−/− MEFs. Images are representative of several independent experiments. F, SCYL3 localizes to the Golgi apparatus. Exponentially growing WT MEFs were fixed and stained with antibodies against SCYL3 and GM130, GS28, COPG1/2 or COPA and counterstained with DAPI. Images are representative of several independent experiments. G, Scyl3−/− MEFs were transfected with plasmid encoding SCYL3. Thirty-six hours after transfection, cells were fixed and stained with antibodies against SCYL3 and GM130, and counterstained with DAPI. Images are representative of several independent experiments. H, SCYL3 is a membrane-associated protein. Microsomal (M) and cytosolic (C) fractions from WT mouse liver were resolved by SDS-PAGE and analyzed by Western blot using antibodies against SCYL3, COPG2, the Golgi-associated protein GM130, and the membrane anchored protein Vti1b. Microsomal fractions were also washed once (1×) or twice (2×) with NaHCO3, pH 11.5, to dislodge membrane-associated but not membrane-anchored proteins. Images are representative of two independent experiments. Scale bars, 10 μm
Figure 2.
Figure 2.
Identification of SCYL3-interacting partners. A, Identification of CASP and components of the COPI complex by affinity enrichment and LC-MS/MS. HEK293T cells were transfected with a plasmid encoding a FLAG-tagged version of SCYL3. Then, 36 h after transfection, lysates from MOCK-transfected or SCYL3-transfected cells were prepared and immunoprecipitated using the M2 affinity matrix. Immune complexes were resolved by SDS-PAGE, and the gel was stained with SYPRO Ruby protein gel stain. Nine bands (1–9) were excised and analyzed by LC-MS/MS. *Indicates bands also found in the MOCK-transfected lane that were not interrogated by MS. Data are representative of two independent experiments. Figure 2-1 presents the number of independent peptides and the complete list of proteins identified. The SCYL3 immune complex contained peptides ascribed to components of the COPI complex, such as COPA, COPB, COPB2, COPG1, COPG2, COPD, CASP, kinesin heavy chain, and heat-shock proteins. B, Validation of SCYL3 association with select putative protein partners. HEK293T cells were transfected with plasmids encoding FLAG-tagged versions of SCYL1, SCYL2, and SCYL3. Then, 36 h after transfection, protein lysates were prepared from SCYL1-, SCYL2-, SCYL3-, or MOCK-transfected cells and immunoprecipitated using the M2 affinity matrix. Cell lysates (L) and immune complexes (IP) were resolved by SDS-PAGE and analyzed by Western blot, using antibodies against CASP, COPG1/2, kinesin heavy chain (KinH), ezrin, and FLAG. C, Several subunits of the COPI complex associate with SCYL3. Indicated amounts of plasmid encoding the FLAG-tagged version of SCYL3 were transfected into HEK293T cells. Then, 36 h after transfection, cell lysates were prepared and immunoprecipitated using the anti-Flag M2 matrix. Immune complexes (IP) and cell lysates (L) were resolved by SDS-PAGE and analyzed by Western blot, using antibodies against COPA, COPB, COPB2, COPG (which recognizes both COPG1 and COPG2), and the FLAG epitope. D, Schematic representation of full-length and truncated versions of SCYL3 used to study SCYL3–COPG, SCYL3–CASP, and SCYL3–SCYL3 interactions. Numbering includes 8 aa of the FLAG epitope (purple). HEAT repeats are labeled 1 through 4. E, Distinct regions of SCYL3 bind to COPG1/2 and CASP. HEK293T cells were transfected with full-length or various FLAG-tagged truncated versions of SCYL3 illustrated in D. Then, 36 h after transfection, protein lysates were prepared from SCYL3- or MOCK-transfected cells and immunoprecipitated using the M2 affinity matrix. Cell lysates and immune complexes were resolved by SDS-PAGE and analyzed by Western blot, using antibodies against COPG1/2 and CASP. Ponceau staining was used to detect FLAG-SCYL3 from immune complexes. F, Homo-oligomerization of SCYL3. HEK293T cells were transfected with full-length or various FLAG-tagged truncated versions of SCYL3 (illustrated in D) together with an HA-tagged full-length version of SCYL3 as indicated. Then, 36 h after transfection, protein lysates from transfected cells were prepared and immunoprecipitated using the M2 affinity matrix (IP). Cell lysates (L) and immune complexes (IP) were resolved by SDS-PAGE and analyzed by Western blot, using antibodies against HA. Ponceau S staining was used to detect FLAG-SCYL3 from immune complexes. G, Schematic representation of SCYL3 domains required for homo-oligomerization, CASP and COPI interactions.
Figure 3.
Figure 3.
Scyl3 is dispensable for embryonic development and postnatal life, COPI function, Golgi size and morphology, CASP subcellular localization, and cell migration. A, Schematic representation of the Scyl3 locus (introns 3–9), targeting vector, and predicted Scyl3 mutant and null alleles. The Scyl3 gene is located on chromosome 1 and contains 14 exons. Only the region containing exons 4–9 is illustrated. Cre-mediated recombination of the Scyl3 locus to generate the null allele was performed in ES cells. The splicing of exon 4 in exons 7, 8, 9, or 10 causes frame shifts and premature STOP codons. Gray bars, Exons; black bars, EcoRI sites; black triangles, loxP; gray triangles, Frt sites; large gray box, neo-TK cassette; black arrow, diphtheria toxin cassette; red arrow, genotyping primer S3F01; orange arrow, genotyping primer S3R02; green arrow, genotyping primer S3R51. B, PCR-based genotyping of Scyl3+/+, Scyl3+/−, and Scyl3−/− mice. Genomic DNA from Scyl3+/+, Scyl3+/−, and Scyl3−/− mice was amplified by PCR, using primers S3F01, S3R51, and S3R02. Bands of 521 bp and 310 bp correspond to the WT (Scyl3+) and null allele (Scyl3), respectively. NTC, no template control. C, SCYL3 expression in WT (Scyl3+/+), Scyl3+/−, and Scyl3−/− MEFs. Protein lysates were prepared from exponentially growing MEFs, resolved by SDS-PAGE, and analyzed by Western blot, using antibodies against SCYL3 or clathrin heavy chain (CHC) as loading control. D, Photograph of WT and Scyl−/− mice. Scyl3−/− mice were viable, fertile, and showed no overt abnormalities. E, VSVG-tsO45-eGFP forward movement in WT and Scyl3−/− MEFs. MEFs were transfected with VSVG-tsO45-eGFP. Then, 24 h after transfection, cells were incubated at 40°C for 12 h and then transferred to 32°C for various time points (0, 5, 20, 60, and 120 min), fixed and stained with GFP antibody, and imaged with a fluorescent microscope. The number of cells showing predominant ER, Golgi/ERGIC, or plasma membrane staining was determined and expressed as percentage of total number of cells analyzed for each independently derived cell line (WT, n = 20–25 cells per time point from 3 cell lines; Scyl3−/−, n = 20–25 cells per time point from 3 cell lines). F, VSVG-tsO45-KDELR-Myc retrograde movement in WT and Scyl3−/− MEFs. MEFs were transfected with VSVG-tsO45-KDELR-Myc and incubated at 32°C. Cells were then transferred to the nonpermissive temperature (40°C) for various time points (0, 30, 60, and 120 min) and fixed and stained with an anti-Myc antibody. The number of cells showing predominant ER or Golgi/ERGIC staining was determined and expressed as percentage of total number of cells analyzed for each independently derived cell line (WT, n = 20–25 cells per time point from 3 cell lines; Scyl3−/−, n = 20–25 cells per time point from 3 cell lines). G, H, Golgi size and morphology in WT and Scyl3-deficieint MEFs. G, Exponentially growing WT and Scyl3−/− MEFs were fixed and stained for CASP and GM130 and imaged by confocal microscopy. H, GM130-positive area (pixels) was determined in WT (n = 162 cells from 3 independently derived cell lines) and Scyl−/− MEFs (n = 142 cells from 3 independently derived cell lines). Data are expressed as the mean ± SEM. No significant differences in size or overall morphology were found between WT and Scyl3−/− MEFs. I, Absence of SCYL3 does not affect CASP localization to the Golgi apparatus. Confocal microscopy of exponentially growing WT and Scyl3−/− MEFs, using antibodies against CASP and GM130. Blue, DAPI staining; green, CASP; red, GM130. J, Migration of WT and Scyl3-deficient MEFs. The distance traveled by each cell line (in quintuplicate) over 24 h was measured. Data are expressed as the mean ± SEM of 15 measurements from three independently derived WT and Scyl3−/− MEFs cell lines. Scale bars, 10 μm
Figure 4.
Figure 4.
COPI and CASP interactions contribute to localization of SCYL3 to the Golgi apparatus. A, Generation of CASP-deficient MEFs using CRISPR–Cas9 technology. Structure of the Cux1 gene encoding CDP and CASP. Exons common to CDP and CASP are illustrated in black (only exons 12–14 illustrated). Exons encoding CDP are illustrated in green, and those encoding CASP are illustrated in blue. To generate CASP-deficient cells, 2 sgRNAs (black arrowheads) were designed to delete exons 15–17. Splicing of exon 14 into exon 18 causes a frame shift and premature stop codon. Red arrow, Cux1-F51 primer; green arrow, Cux-R32 primer. B, PCR genotyping of the WT and 2 independently derived CASP-deficient MEF lines (Cl.7 and Cl.8). Bands of 2496 and ∼495 bp correspond to WT and null CASP-null alleles, respectively. A smaller band (*) from internal priming sites was also obtained by using these primers. NTC, No template control. Sanger sequencing confirmed proper recombination of the allele in CASP-deficient MEFs. C, Western blot analysis of CASP and β-actin (as loading control) in WT and CASP-deficient MEFs. *Indicates nonspecific bands. D, Immunofluorescence staining of CASP and GM130 in WT and CASP-deficient MEFs. Exponentially growing WT and CASP-deficient MEFs were fixed and stained for CASP and GM130 and imaged by confocal microscopy. E, SCYL3 localization in WT and CASP-deficient MEFs. Exponentially growing WT and CASP-deficient MEFs were fixed and stained for SCYL3 and GM130 and imaged by confocal microscopy. F, Subcellular localization of full-length and key truncated version of SCYL3 in Scyl3-deficient MEFs. Exponentially growing Scyl3−/− MEFs were transfected with full-length or the indicated truncated versions of SCYL3, fixed and stained for SCYL3 and GM130, and imaged by confocal microscopy.
Figure 5.
Figure 5.
Scyl3 deficiency exacerbates growth and motor phenotypes associated with the absence of Scyl1. A, Representative photograph of 8-week-old (wo) Scyl1−/− and Scyl1−/−;Scyl3−/− male littermates showing size differences between these genotypes. B, Body weight of 4- and 8-week-old WT (4-week-old mice, n = 22; 8-week-old mice, n = 13), Scyl1−/− (4-week-old mice, n = 22; 8-week-old mice, n = 15), Scyl3−/− (4-week-old mice, n = 12; 8-week-old mice, n = 8), and Scyl1−/−;Scyl3−/− (4-week-old mice, n = 8; 8-week-old mice, n = 3) males. Data are expressed as mean ± SEM. P values, determined by one-tailed Student's t test, are indicated on the graph. C, Disease progression in 4- and 8-week-old WT (4-week-old mice, n = 11; 8-week-old mice, n = 11), Scyl1−/− (4-week-old mice, n = 17; 8-week-old mice, n = 14), Scyl3−/− (4-week-old mice, n = 12; 8-week-old mice, n = 4), and Scyl1−/−;Scyl3−/− (4-week-old mice, n = 13; 8-week-old mice, n = 3) mice. Disease progression in mice was assessed by using an objective grading system as described in Materials and Methods. Data are expressed as mean ± SEM. P values, determined by the one-tailed Student's t test, are indicated on the graph. D, Motor defects in 4- and 8-week-old WT (4-week-old mice, n = 10; 8-week-old mice, n = 12), Scyl1−/− (4-week-old mice, n = 29; 8-week-old mice, n = 12), Scyl3−/− (4-week-old mice, n = 16; 8-week-old mice, n = 12) and Scyl1−/−;Scyl3−/− mice (4-week-old mice, n = 9; 8-week-old mice, n = 3). The inverted grid test was performed on 4- and 8-week-old mice as described in Materials and Methods. Data are expressed as mean ± SEM. P values, determined by the one-tailed Student's t test, are indicated on the graph.
Figure 6.
Figure 6.
Myopathologic abnormalities in Scyl1−/− and Scyl1−/−;Scyl3−/− mice. A, Representative micrographs of H&E-stained sections of rectus femoris from 4- and 8-week-old WT, Scyl1−/−, Scyl3−/−, and Scyl1−/−;Scyl3−/− mice. B, Muscle cross-sectional area of rectus femoris of 4- and 8-week-old WT, Scyl1−/−, Scyl3−/−, and Scyl1−/−;Scyl3−/− mice (n = 3 for each genotype and age group). C, Total number of muscle fibers in rectus femoris of 4- and 8-week-old WT, Scyl1−/−, Scyl3−/−, and Scyl1−/−;Scyl3−/− mice (n = 3 for each genotype and age group). D, Muscle fiber cross-sectional area of rectus femoris of 4- and 8-week-old WT, Scyl1−/−, Scyl3−/−, and Scyl1−/−;Scyl3−/− mice (n = 3 for each genotype and age group). E, Percentage of angulated/atrophied fibers in rectus femoris of 4- and 8-week-old WT, Scyl1−/−, Scyl3−/−, and Scyl1−/−;Scyl3−/− mice (n = 3 for each genotype and age group). F, Representative micrographs of H&E-stained sections of bicep brachii from 4- and 8-week-old WT, Scyl1−/−, Scyl3−/−, and Scyl1−/−;Scyl3−/− mice. G, Muscle cross-sectional area of bicep brachii of 4- and 8-week-old WT, Scyl1−/−, Scyl3−/−, and Scyl1−/−;Scyl3−/− mice (n = 3 for each genotype and age group). H, Total number of muscle fibers in bicep brachii of 4- and 8-week-old WT, Scyl1−/−, Scyl3−/−, and Scyl1−/−;Scyl3−/− mice (n = 3 for each genotype and age group). I, Muscle fiber cross-sectional area of bicep brachii of 4- and 8-week-old WT, Scyl1−/−, Scyl3−/−, and Scyl1−/−;Scyl3−/− mice (n = 3 for each genotype and age group). J, Percentage of angulated/atrophied fibers in bicep brachii of 4- and 8-week-old WT, Scyl1−/−, Scyl3−/−, and Scyl1−/−;Scyl3−/− mice (n = 3 for each genotype and age group). Data are expressed as mean ± SEM. P values determined by two-tailed Student's t test. a, WT versus Scyl1−/−, p < 0.05; b, WT versus Scyl1−/−; Scyl3−/−, p < 0.05; c, Scyl1−/− versus Scyl1−/−;Scyl3−/−, p < 0.05; d, WT versus Scyl3−/−, p < 0.05.
Figure 7.
Figure 7.
Loss of large-caliber axons in Scyl1−/− and Scyl1−/−;Scyl3−/− mice. A, Representative micrograph of toluidine blue-stained semithin sections of sciatic nerve from 4- and 8-week-old WT, Scyl1−/−, Scyl3−/−, and Scyl1−/−;Scyl3−/− mice. B, Myelinated axon counts in sciatic nerve of 4- and 8-week-old WT, Scyl1−/−, Scyl3−/−, and Scyl1−/−;Scyl3−/− mice (n = 3 for each age group and genotype). Data are expressed as mean ± SEM. P values, determined by the one-tailed Student's t test, are indicated on the graph. C, Histogram of the frequency of myelinated axons in sciatic nerves of 4- and 8-week-old WT, Scyl1−/−, Scyl3−/−, and Scyl1−/−;Scyl3−/− mice (n = 3 for each age group and genotype) as a function of axon diameter. Data are expressed as mean ± SEM. P values determined by two-tailed Student's t test. a, WT versus Scyl1−/−, p < 0.05; b, WT versus Scyl1−/−; Scyl3−/−, p < 0.05; c, Scyl1−/− versus Scyl1−/−;Scyl3−/−, p < 0.05.
Figure 8.
Figure 8.
Loss of large motor neurons in the ventral horn of Scyl1−/− and Scyl1−/−;Scyl3−/− mice. A, Representative micrographs of H&E-stained lumbar ventral horn motor neurons in 4- and 8-week-old WT, Scyl1−/−, Scyl3−/−, and Scyl1−/−;Scyl3−/− mice. Arrows indicate healthy motor neurons. White triangles indicate motor neurons exhibiting rarefaction of cytosolic organelle. Black circles indicate motor neurons exhibiting central chromatolysis. B, Higher-magnification micrograph of healthy motor neurons (top left) and motor neurons exhibiting central chromatolysis (bottom left) or rarefaction of cytosolic organelles (right). Glial cells are in close contact with two degenerative motor neurons (arrowheads). Arrows indicate healthy motor neurons. White triangles indicate motor neurons exhibiting rarefaction of cytosolic organelle. Black circles indicate motor neurons exhibiting central chromatolysis. Black arrowheads show microglial cells surrounding and ingesting degenerated neurons (neuronophagia). C, Numbers of ventral horn motor neuron in 4- and 8-week-old WT, Scyl1−/−, Scyl3−/−, and Scyl1−/−;Scyl3−/− mice (n = 3 for each age group and genotype). The number of healthy motor neurons was determined as described in Materials and Methods. Data are expressed as mean ± SEM. P values, determined by one-tailed Student's t test, are indicated on the graph. D, Quantification of lumbar ventral horn motor neurons showing central chromatolysis in WT, Scyl1−/−, Scyl3−/−, and Scyl1−/−;Scyl3−/− mice (n = 3 for each age group and genotype). Data are expressed as mean ± SEM. P values, determined by one-tailed Student's t test, are indicated on the graph. E, Quantification of motor neurons with rarefaction of cytosolic organelles in the ventral horn of 4- and 8-week-old WT, Scyl1−/−, Scyl3−/−, and Scyl1−/−;Scyl3−/− mice (n = 3 for each age group and genotype). Data are expressed as mean ± SEM. P values, determined by one-tailed Student's t test, are indicated on the graph. F, G, Neuroinflammation in the spinal ventral horn of Scyl1−/−, Scyl3−/−, and Scyl1−/−;Scyl3−/− mice. Immunohistochemistry using antibodies against GFAP (F) and Iba1 (G) on spinal ventral horn sections of 8-week-old WT, Scyl1−/−, Scyl3−/−, and Scyl1−/−;Scyl3−/− mice. Data are expressed as mean ± SEM. P values determined by two-tailed Student's t test. a, WT versus Scyl1−/−, p < 0.05; b, WT versus Scyl1−/−; Scyl3−/−, p < 0.05; c, Scyl1−/− versus Scyl1−/−;Scyl3−/−, p < 0.05; d, WT versus Scyl3−/−, p < 0.05.
Figure 9.
Figure 9.
Nuclear-to-cytoplasmic redistribution of TDP-43 in spinal motor neurons of Scyl1−/− and Scyl1−/−;Scyl3−/− mice. A, Expression of SCYL1 and SCYL3 in brain and spinal cord. Tissue distribution of SCYL proteins in WT, Scyl1−/−, Scyl3−/−, and Scyl1−/−;Scyl3−/− mice. Protein extracts prepared from various mouse tissues were resolved by SDS-PAGE and analyzed by Western blot, using antibodies against SCYL1, SCYL3, β-actin. Ponceau staining of the membrane is also shown as loading control. *Indicates nonspecific band. B, Overlapping expression of SCYL1 and SCYL1 in spinal motor neurons. Immunohistochemical staining of spinal cord cross-sections from WT, Scyl1−/− and Scyl3−/− mice, using antibodies against SCYL1 or SCYL3. Arrows indicate expression of SCYL1 or SCYL3 in spinal motor neurons. C, Immunohistochemistry using antibodies against TDP-43 on lumbar spinal ventral horn sections from 4- and 8-week-old WT, Scyl1−/−, Scyl3−/−, and Scyl1−/−;Scyl3−/− mice. Arrows indicate spinal motor neurons with relocalized TDP-43. D, Quantification of cells exhibiting TDP-43 pathology in ventral horn of 4- and 8-week-old WT, Scyl1−/−, Scyl3−/−, and Scyl1−/−;Scyl3−/− mice (n = 3 for each age group and genotype). Data are expressed as mean ± SEM. P values, determined by the one-tailed Student's t test, are indicated on the graph. a, WT versus Scyl1−/−, p < 0.05; b, WT versus Scyl1−/−; Scyl3−/−, p < 0.05; c, Scyl1−/− versus Scyl1−/−;Scyl3−/−, p < 0.05.

Similar articles

Cited by

References

    1. Blot S, Poirier C, Dreyfus PA (1995) The mouse mutation muscle deficient (mdf) is characterized by a progressive motoneuron disease. J Neuropathol Exp Neurol 54:812–825. - PubMed
    1. Boudeau J, Miranda-Saavedra D, Barton GJ, Alessi DR (2006) Emerging roles of pseudokinases. Trends Cell Biol 16:443–452. 10.1016/j.tcb.2006.07.003 - DOI - PubMed
    1. Burman JL, Bourbonniere L, Philie J, Stroh T, Dejgaard SY, Presley JF, McPherson PS (2008) Scyl1, mutated in a recessive form of spinocerebellar neurodegeneration, regulates COPI-mediated retrograde traffic. J Biol Chem 283:22774–22786. 10.1074/jbc.M801869200 - DOI - PubMed
    1. Burman JL, Hamlin JN, McPherson PS (2010) Scyl1 regulates Golgi morphology. PloS One 5:e9537. 10.1371/journal.pone.0009537 - DOI - PMC - PubMed
    1. Chafe SC, Mangroo D (2010) Scyl1 facilitates nuclear tRNA export in mammalian cells by acting at the nuclear pore complex. Mol Biol Cell 21:2483–2499. 10.1091/mbc.E10-03-0176 - DOI - PMC - PubMed

Publication types

MeSH terms