. 2018 Mar 15;200(6):2186-2198.
doi: 10.4049/jimmunol.1701638. Epub 2018 Feb 7.

T Cell Expression of C5a Receptor 2 Augments Murine Regulatory T Cell (TREG) Generation and TREG-Dependent Cardiac Allograft Survival

Affiliations

T Cell Expression of C5a Receptor 2 Augments Murine Regulatory T Cell (TREG) Generation and TREG-Dependent Cardiac Allograft Survival

Divya A Verghese et al. J Immunol. .

Abstract

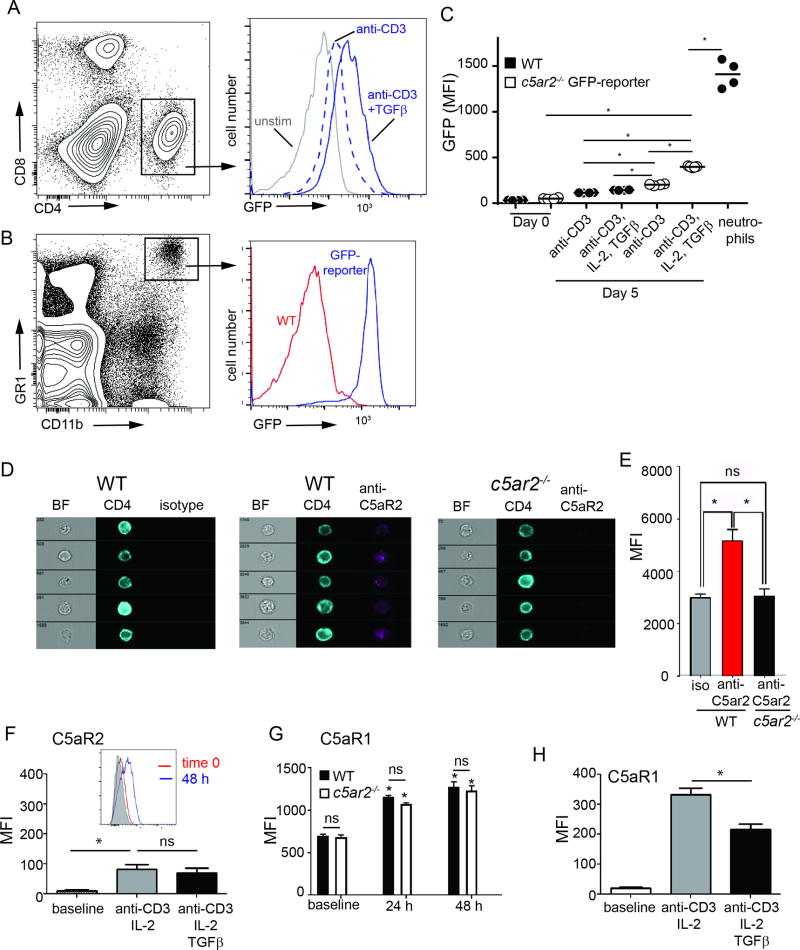
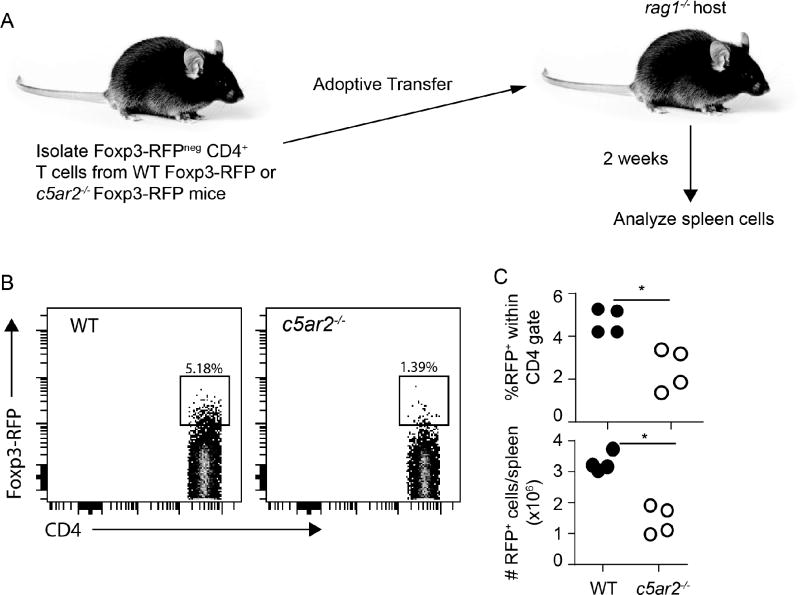
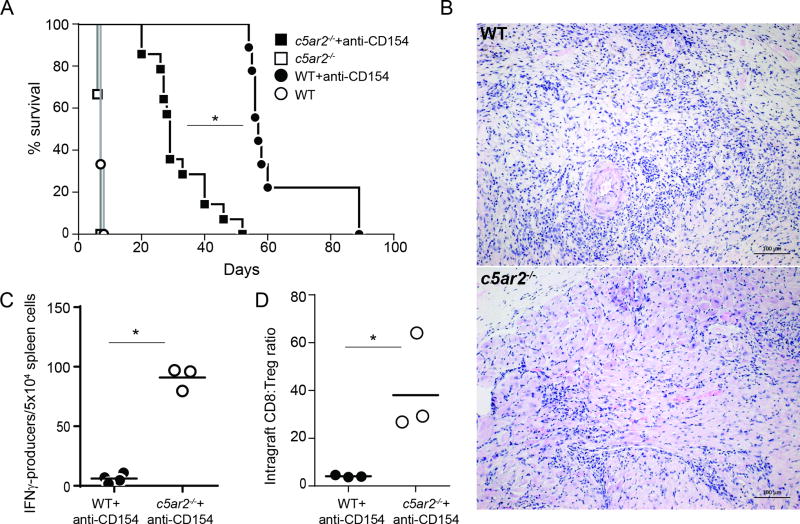
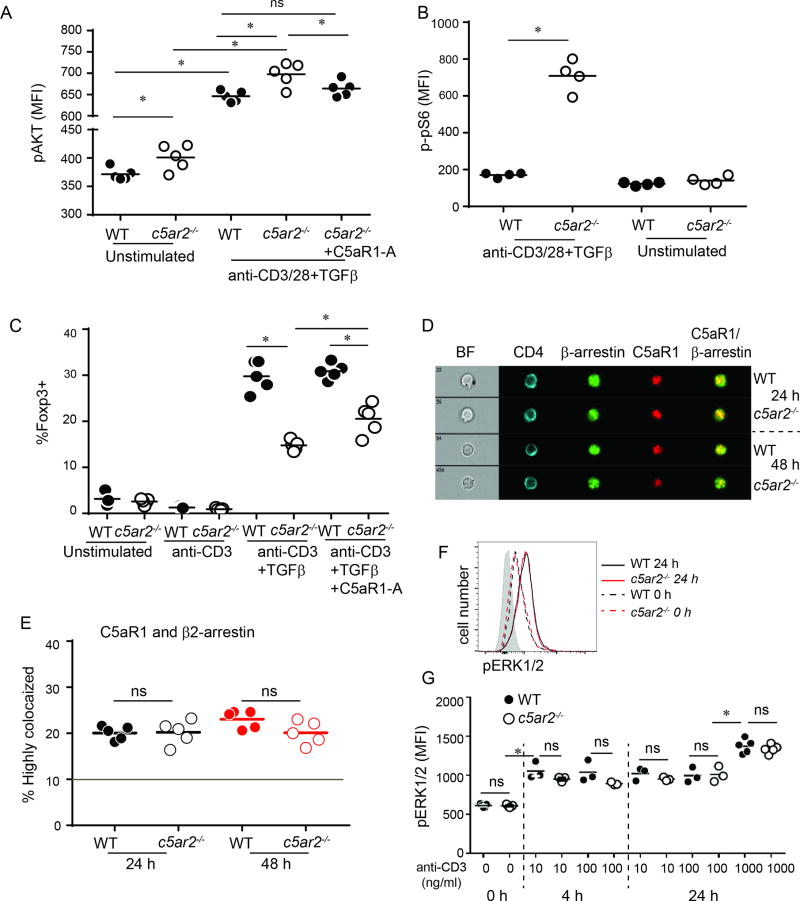
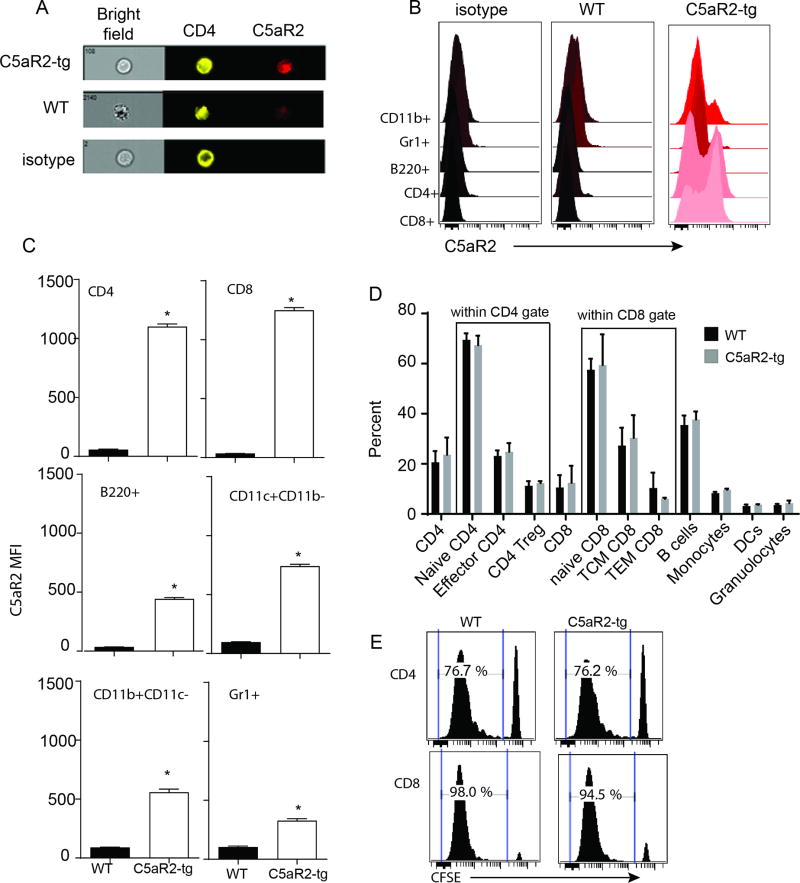
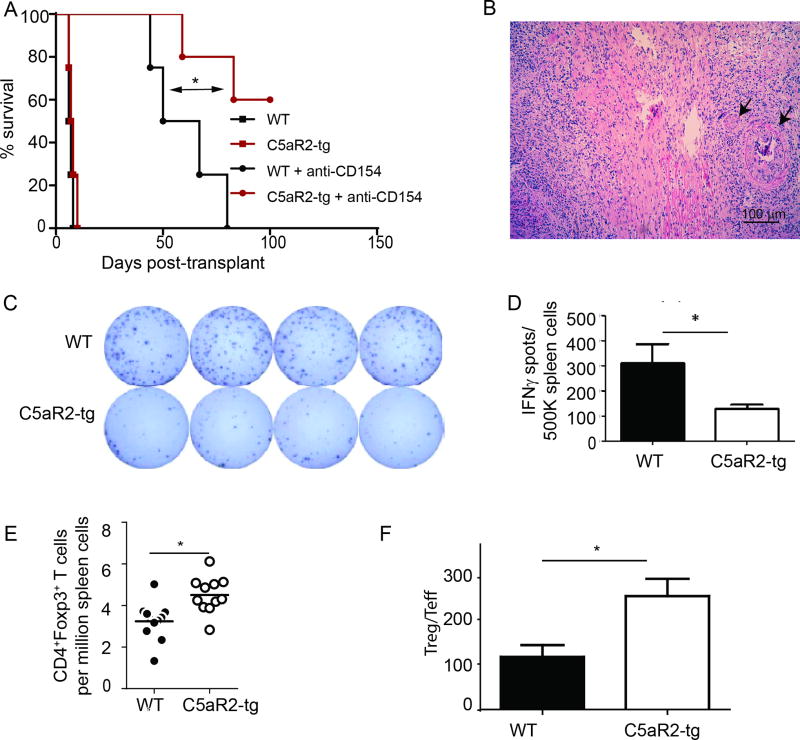
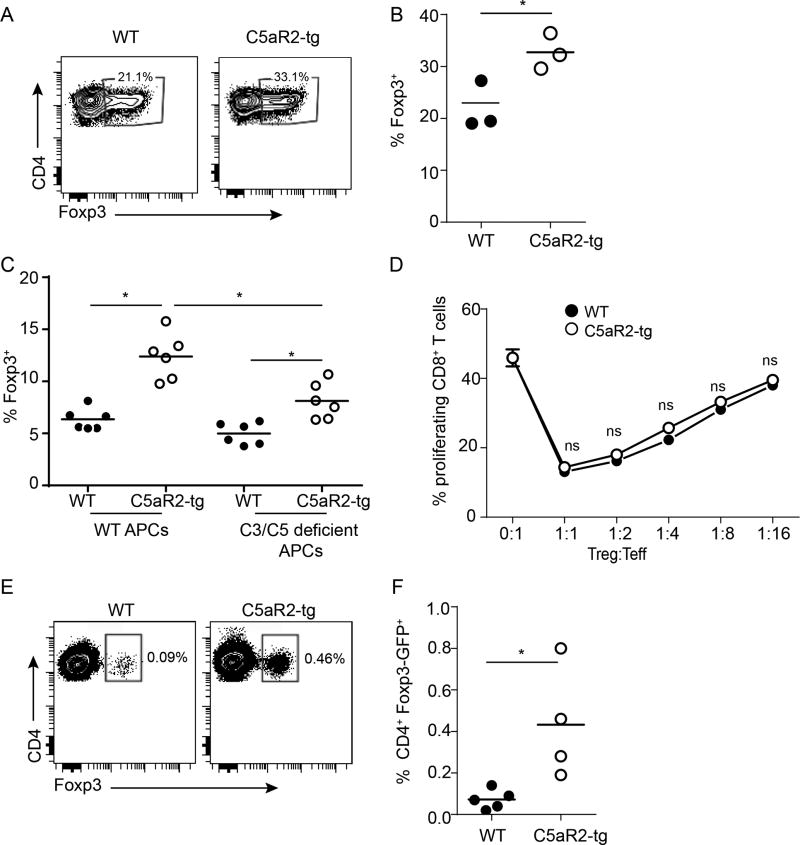
C5aR2 (C5L2/gp77) is a seven-transmembrane spanning receptor that binds to C5a but lacks motifs essential for G protein coupling and associated signal transduction. C5aR2 is expressed on immune cells, modulates various inflammatory diseases in mice, and has been shown to facilitate murine and human regulatory T cell (TREG) generation in vitro. Whether and how C5aR2 impacts in vivo TREG generation and pathogenic T cell-dependent disease models have not been established. In this article, we show that murine T cells express and upregulate C5aR2 during induced TREG (iTREG) generation and that the absence of T cell-expressed C5aR2 limits in vivo iTREG generation following adoptive transfer of naive CD4+ T cells into Rag1-/- recipients. Using newly generated C5aR2-transgenic mice, we show that overexpression of C5aR2 in naive CD4+ T cells augments in vivo iTREG generation. In a model of TREG-dependent cardiac allograft survival, recipient C5aR2 deficiency accelerates graft rejection associated with lower TREG/effector T cell ratios, whereas overexpression of C5aR2 in immune cells prolongs graft survival associated with an increase in TREG/effector T cell ratios. T cell-expressed C5aR2 modulates TREG induction without altering effector T cell proliferation or cytokine production. Distinct from reported findings in neutrophils and macrophages, TREG-expressed C5aR2 does not interact with β-arrestin or inhibit ERK1/2 signaling. Rather, cumulative evidence supports the conclusion that C5aR2 limits C5aR1-initiated signals known to inhibit TREG induction. Together, the data expand the role of C5aR2 in adaptive immunity by providing in vivo evidence that T cell-expressed C5aR2 physiologically modulates iTREG generation and iTREG-dependent allograft survival.


Conflict of interest statement

Disclosure of Conflicts of Interest

None

Figures

Figure 1
Figure 1
C5aR2 is expressed in CD4+ TREG. A. Representative flow cytometry plot gated on CD4+ cells (left panel) showing GFP expression (right panel) within splenic c5ar2−/− C5aR2-GFP reporter mice at baseline (grey line) and on day 5 following stimulation with anti-CD3 (blue dashed lines) or anti-CD3 + TGFβ/IL2 (blue solid lines). B. Representative flow cytometry plot showing GFP expression (right panel) from WT (no reporter, red) and c5ar2−/− GFP-reporter (blue) mice gated on unstimulated GR1+CD11b+ neutrophils (left panel). C. Quantified results of GFP expression in WT and c5ar2−/− GFP reporter CD4+ T cells under the conditions listed. n=4/group. D–E. Five representative images (D) and quantified results (E) from imaging flow studies of spleen cells from WT or c5ar2−/− mice stimulated in vitro for 48 h with anti-CD3, TGFβ and IL-2. Bright field (BR) images and images stained with anti-CD4, anti-C5aR2 or isotype control as indicated are shown (a duplicate enlarged version of 1D is provided as Supplemental Figure 1A). F. Insert: representative standard flow cytometry plot of C5aR2 expression on unstimulated (red) or anti-CD3 stimulated (48 h, blue) WT spleen cells gated on CD4+ T cells. Gray filled histogram: isotype control. Median fluorescence intensity (MFI) of surface expressed C5aR2 on spleen cells gated on the CD4+ subset, at (baseline) and 48 h after stimulation with anti-CD3+IL-2 or anti-CD3+IL-2+TGFβ as indicated. n=4/group. G. Surface expression of C5aR1 on WT and c5ar2−/− spleen cells within the CD4+ gate at baseline and 24 and 48 h after in vitro stimulation with anti-CD3. Representative flow cytometry plot is shown in Supplemental Figure 1. H. Median fluorescence intensity (MFI) of surface expressed C5aR1 on spleen cells gated on the CD4+ subset, at (baseline) and 48 h after stimulation with anti-CD3+IL-2 or anti-CD3+IL-2+TGFβ as indicated. n=4/group. All experiments were repeated at least once. ns=not significant. *p<0.05 throughout; in panel G, * refers to comparison with expression level at baseline.
Figure 2
Figure 2
Absence of C5aR2 limits iTREG generation. A–B. Representative flow plots (A) and quantification for IFNγ expression (B) in an MLR gated on CD8+ T cells from spleens of WT B6 mice stimulated with BALB/c stimulators for 4 days. C. Representative flow plot for CFSE and IFNγ expression in an MLR using naive CD62LhiCD44loCD4+ T cells from WT B6 mice stimulated with BALB/c stimulators for 4 days. D. Quantification of proliferating CSFElo naive WT vs c5ar2−/− CD4+ T cells stimulated with syngeneic (control) or allogeneic stimulators (bottom),and percent IFNγ+ within the CFSElo population (top), gated on CD4+ T cells. n=4/group, one of 2 representative experiments. E–F. Representative flow plots (E) and quantified percentages of Foxp3-RFP+ iTREG (F) on day 4 after stimulating naïve WT or c5ar2−/− Foxp3-RFP T cells with allogeneic APCs, IL-2 and TGFβ. G–H. In vitro suppression assays using flow sorted WT or c5ar2−/− Foxp3-RFP+ iTREG obtained from cultures in C–D (G) or flow sorted splenic Foxp3-RFP+CD4+ T cells from WT or c5ar2−/− Foxp3-RFP+ mice (H). no significant differences were noted at any of the TREG:TEFF ratios in either experiment. ns=not significant, *p<0.05.
Figure 3
Figure 3
C5aR2 deficiency limits iTREG generation in vivo. A. Schematic of experimental design. B. Representative flow cytometry plots depicting splenic Foxp3-RFP+ cells within the CD4 gate 2 weeks after adoptive transfer of Foxp3-RFPneg, naïve WT or c5ar2−/− Foxp3-RFP CD4+ T cells into rag1−/− recipients. C. Quantification of results showing percentages (top) and total number (bottom) of iTREG in each animal. *p<0.05.
Figure 4
Figure 4
Recipient C5aR2 deficiency accelerates T cell mediated cardiac allograft rejection. A. Survival of WT and congenic c5ar2−/− B6 recipients transplanted with allogeneic BALB/c hearts ± peri-transplant anti-CD154 mAb (MR1, 250 µg). B. Representative H&E stained sections of transplanted BALB/c heart tissue (7–9 animals per group) obtained at the time of rejection showing diffuse mononuclear cell infiltration consistent with acute cellular rejection in the WT and congenic c5ar2−/− B6 recipients. C–D. Groups of MR1-treated WT and c5ar2−/− allograft recipients were sacrificed on day 21 posttransplant. C. Splenic donor-reactive IFNγ producers were quantified by ELISPOT (one of three independent experiments with similar results). D. Intragraft ratios of CD8+ T cells to CD4+Foxp3+ T cells as determined by flow cytometric analysis of graft infiltrating lymphocytes. *p<0.05
Figure 5
Figure 5
C5aR2 expression augments iTREG generation by limiting C5a/C5aR1 signaling on CD4+ T cells. A–B. Quantification of intracellular phosphoflow cytometry analysis of pAKT (A) and p-pS6 (B) in naïve WT and c5ar2−/− CD4+ T cells cultured with syngeneic APCs for 24 h under the conditions listed (anti-CD3, 100 µg/ml). Results are representative of ≥ 2 independent experiments. C. Foxp3 expression at the end of 5 day iTREG generation assays using magnetically sorted naïve CD4+ WT and c5ar2−/− cells under the conditions listed (anti-CD3 added at 1000 µg/ml). D-E. Representative imaging flow images (D) and quantified co-localization of C5aR1 and β2-arrestin (E) in WT and c5ar2−/− CD4+ T cells cultured for 24 or 48 h under iTREG generating conditions (anti-CD3 1000 µg/ml). F. Representative flow cytometry plot (top) and quantification of intracellular phosphoflow cytometry analysis of pERK1/2 in WT and c5ar2−/− CD4+ T cells cultured for 4-24 h with anti-CD3 at the concentrations listed + IL-2 and TGFβ. ns=not significant. *p<0.05
Figure 6
Figure 6
Characterization of C5aR2-tg mice. A. Representative imaging flow images demonstrating elevated expression of C5aR2 within freshly isolated unstimulated CD4+ T cells from C5aR2-tg animals. B–C. Representative standard flow cytometry overlay histogram plots (B) and quantified MFI values (C) depicted surface C5aR2 expression levels gated on the indicated cell types from WT and C5aR2-tg mice. D. Flow cytometric analysis of spleen cells from WT and C5aR2-tg mice showing no significant differences in the percentages of the major immune cell populations between groups. n=3–5 per group per experiment. E. Representative in vitro MLRs using CFSE labeled spleen cells from WT and C5aR2-tg mice stimulated for 3 days in culture with BALB/c APCs demonstrate no significant differences between groups (p=ns for 4 replicates per condition, repeated with same results). *p<0.05.
Figure 7
Figure 7
Transgenic overexpression of C5aR2 under CD2 promoter promotes graft survival associated with fewer TEFF and more TREG. A. Survival of BALB/c hearts transplanted into WT or C5aR2-tg recipients ± peri-transplant MR1 (250 µg). The experiment was halted at 100 days posttransplant. Survival of the WT and the C5aR2-tg recipients treated with MR1 were significantly longer than untreated WT and C5aR2-tg recipients. Survival of grafts transplanted into anti-CD154-treated C5aR2-tg was statistically longer than those transplanted into anti-CD154-treated WT controls (*p<0.05). B. Representative H&E stained section from a BALB/c heart transplanted into an anti-CD154-treated C5aR2-tg recipient that was beating on day 100 posttransplant, demonstrating diffuse mononuclear cell infiltrates and vasculopathy (arrowheads). C–D. Representative IFNγ ELISPOT wells (C) and quantification of splenic donor-reactive IFNγ-producers (D) on day 28 posttransplant in MR1-treated WT and C5aR2-tg recipients of BALB/c hearts. E–F. Total numbers of CD4+Foxp3+ splenic T cells (E) and ratios of TREG to splenic donor-reactive IFNγ producers (TEFF, F) in same animals depicted in C. *p<0.05.
Figure 8
Figure 8
Transgenic overexpression of C5aR2 promotes iTREG generation in vitro and in vivo. A–C. Representative flow cytometry plots (A) and quantified Foxp3-GFP+ percentages on day 3 of iTREG generation cultures (B–C) using flow sorted Foxp3-GFPneg naïve WT and C5aR2-tg Foxp3-GFP CD4+ T cells and WT (B–C) or C3/C5 deficient allogeneic APCs (C). D. In vitro suppression assays using flow sorted Foxp3-GFP+ iTREG induced in B. E–F. In vivo iTREG generation assays. Representative flow cytometry plots (E) and quantification of splenic Foxp3-GFP+ CD4+ in spleens (F) of rag1−/− recipients 2 weeks after adoptive transfer of equal numbers of flow sorted Foxp3-GFPneg WT or C5aR2-tg Foxp3-GFP CD4+ T cells. *p<0.05, ns indicates p>0.05, not significant.

Similar articles

Cited by

References

    1. Maynard CL, Hatton RD, Helms WS, Oliver JR, Stephensen CB, Weaver CT. Contrasting roles for all-trans retinoic acid in TGF-beta-mediated induction of Foxp3 and Il10 genes in developing regulatory T cells. J Exp Med. 2009;206:343–357. - PMC - PubMed
    1. Fontenot JD, Gavin MA, Rudensky AY. Foxp3 programs the development and function of CD4+CD25+ regulatory T cells. Nat Immunol. 2003;4:330–336. - PubMed
    1. Kronenberg M, Rudensky A. Regulation of immunity by self-reactive T cells. Nature. 2005;435:598–604. - PubMed
    1. Samstein RM, Josefowicz SZ, Arvey A, Treuting PM, Rudensky AY. Extrathymic generation of regulatory T cells in placental mammals mitigates maternal-fetal conflict. Cell. 2012;150:29–38. - PMC - PubMed
    1. Kim JM, Rasmussen JP, Rudensky AY. Regulatory T cells prevent catastrophic autoimmunity throughout the lifespan of mice. Nat Immunol. 2007;8:191–197. - PubMed

Publication types

MeSH terms

Substances