SF3B1 deficiency impairs human erythropoiesis via activation of p53 pathway: implications for understanding of ineffective erythropoiesis in MDS
- PMID: 29433555
- PMCID: PMC5810112
- DOI: 10.1186/s13045-018-0558-8
SF3B1 deficiency impairs human erythropoiesis via activation of p53 pathway: implications for understanding of ineffective erythropoiesis in MDS
Abstract
Background: SF3B1 is a core component of splicing machinery. Mutations in SF3B1 are frequently found in myelodysplastic syndromes (MDS), particularly in patients with refractory anemia with ringed sideroblasts (RARS), characterized by isolated anemia. SF3B1 mutations have been implicated in the pathophysiology of RARS; however, the physiological function of SF3B1 in erythropoiesis remains unknown.
Methods: shRNA-mediated approach was used to knockdown SF3B1 in human CD34+ cells. The effects of SF3B1 knockdown on human erythroid cell differentiation, cell cycle, and apoptosis were assessed by flow cytometry. RNA-seq, qRT-PCR, and western blot analyses were used to define the mechanisms of phenotypes following knockdown of SF3B1.
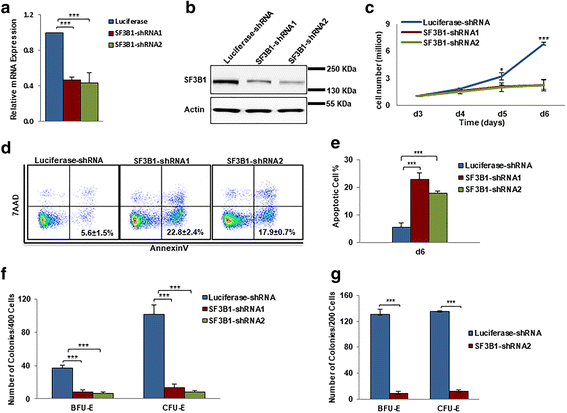
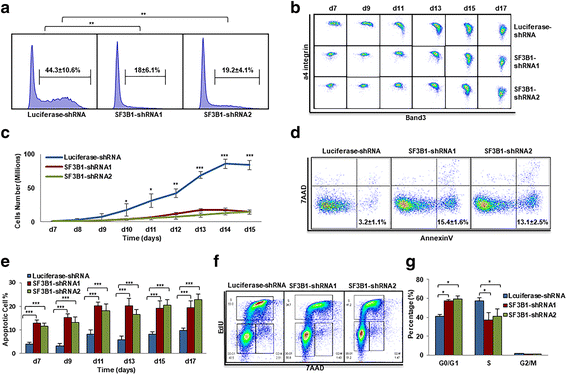
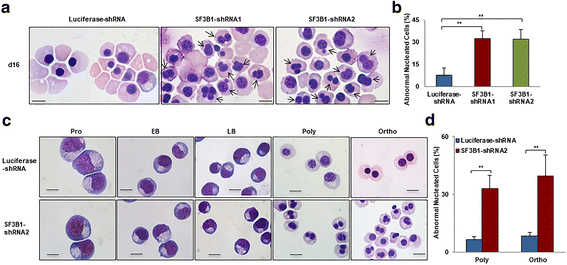
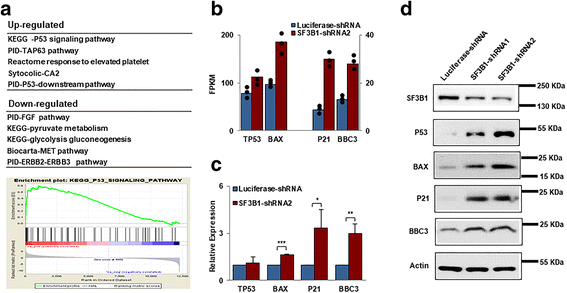
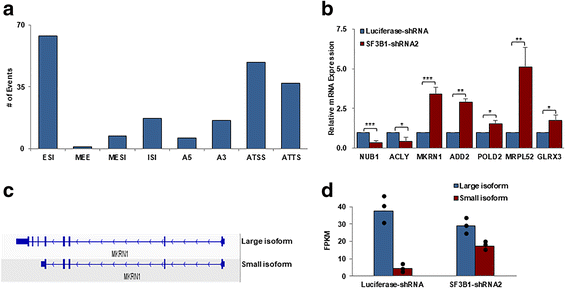
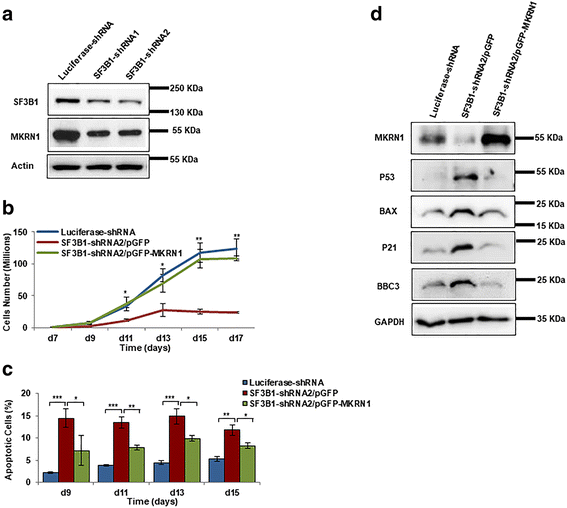
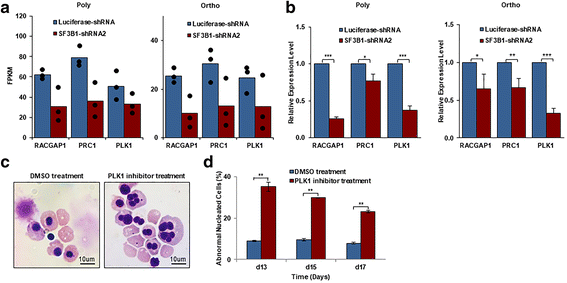
Results: We document that SF3B1 knockdown in human CD34+ cells leads to increased apoptosis and cell cycle arrest of early-stage erythroid cells and generation of abnormally nucleated late-stage erythroblasts. RNA-seq analysis of SF3B1-knockdown erythroid progenitor CFU-E cells revealed altered splicing of an E3 ligase Makorin Ring Finger Protein 1 (MKRN1) and subsequent activation of p53 pathway. Importantly, ectopic expression of MKRN1 rescued SF3B1-knockdown-induced alterations. Decreased expression of genes involved in mitosis/cytokinesis pathway including polo-like kinase 1 (PLK1) was noted in SF3B1-knockdown polychromatic and orthochromatic erythroblasts comparing to control cells. Pharmacologic inhibition of PLK1 also led to generation of abnormally nucleated erythroblasts.
Conclusions: These findings enabled us to identify novel roles for SF3B1 in human erythropoiesis and provided new insights into its role in regulating normal erythropoiesis. Furthermore, these findings have implications for improved understanding of ineffective erythropoiesis in MDS patients with SF3B1 mutations.
Keywords: Apoptosis; Human erythropoiesis; P53; SF3B1.
Conflict of interest statement
Ethics approval and consent to participate
Not applicable.
Consent for publication
Not applicable.
Competing interests
The authors declare that they have no competing interests.
Publisher’s note
Springer Nature remains neutral with regard to jurisdictional claims in published maps and institutional affiliations.
Figures
Similar articles
-
SF3B1 mutant-induced missplicing of MAP3K7 causes anemia in myelodysplastic syndromes.Proc Natl Acad Sci U S A. 2022 Jan 4;119(1):e2111703119. doi: 10.1073/pnas.2111703119. Proc Natl Acad Sci U S A. 2022. PMID: 34930825 Free PMC article.
-
Disruption of SF3B1 results in deregulated expression and splicing of key genes and pathways in myelodysplastic syndrome hematopoietic stem and progenitor cells.Leukemia. 2015 May;29(5):1092-103. doi: 10.1038/leu.2014.331. Epub 2014 Nov 27. Leukemia. 2015. PMID: 25428262 Free PMC article.
-
Aberrant splicing of genes involved in haemoglobin synthesis and impaired terminal erythroid maturation in SF3B1 mutated refractory anaemia with ring sideroblasts.Br J Haematol. 2015 Nov;171(4):478-90. doi: 10.1111/bjh.13610. Epub 2015 Aug 10. Br J Haematol. 2015. PMID: 26255870 Free PMC article.
-
[Dyserythropoiesis in myelodysplastic syndrome].Rinsho Ketsueki. 2018;59(10):2036-2041. doi: 10.11406/rinketsu.59.2036. Rinsho Ketsueki. 2018. PMID: 30305506 Review. Japanese.
-
Refractory anemia with ring sideroblasts.Best Pract Res Clin Haematol. 2013 Dec;26(4):377-85. doi: 10.1016/j.beha.2013.09.005. Epub 2013 Oct 1. Best Pract Res Clin Haematol. 2013. PMID: 24507814 Review.
Cited by
-
Impairment of human terminal erythroid differentiation by histone deacetylase 5 deficiency.Blood. 2021 Oct 28;138(17):1615-1627. doi: 10.1182/blood.2020007401. Blood. 2021. PMID: 34036344 Free PMC article.
-
TET2 deficiency leads to stem cell factor-dependent clonal expansion of dysfunctional erythroid progenitors.Blood. 2018 Nov 29;132(22):2406-2417. doi: 10.1182/blood-2018-05-853291. Epub 2018 Sep 25. Blood. 2018. PMID: 30254129 Free PMC article.
-
Deubiquitylase USP7 regulates human terminal erythroid differentiation by stabilizing GATA1.Haematologica. 2019 Nov;104(11):2178-2187. doi: 10.3324/haematol.2018.206227. Epub 2019 Mar 14. Haematologica. 2019. PMID: 30872372 Free PMC article.
-
SF3B1 mutations in myelodysplastic syndromes: A potential therapeutic target for modulating the entire disease process.Front Oncol. 2023 Mar 17;13:1116438. doi: 10.3389/fonc.2023.1116438. eCollection 2023. Front Oncol. 2023. PMID: 37007111 Free PMC article. Review.
-
Human Cancer-Associated Mutations of SF3B1 Lead to a Splicing Modification of Its Own RNA.Cancers (Basel). 2020 Mar 11;12(3):652. doi: 10.3390/cancers12030652. Cancers (Basel). 2020. PMID: 32168916 Free PMC article.
References
Publication types
MeSH terms
Substances
Grants and funding
LinkOut - more resources
Full Text Sources
Other Literature Sources
Medical
Molecular Biology Databases
Research Materials
Miscellaneous

