

Longitudinal Increases in Adiposity Contribute to Worsening Adipokine Profile over Time in Mexican Americans
- PMID: 29427376
- PMCID: PMC6021026
- DOI: 10.1002/oby.22128
Longitudinal Increases in Adiposity Contribute to Worsening Adipokine Profile over Time in Mexican Americans
Abstract
Objective: Limited studies have assessed the relationship between longitudinal changes in adiposity and changes in multiple adipokines over time. This study examined changes in BMI, total body fat, and trunk fat associated with changes in 16 circulating adipokines in Mexican Americans at risk for type 2 diabetes.
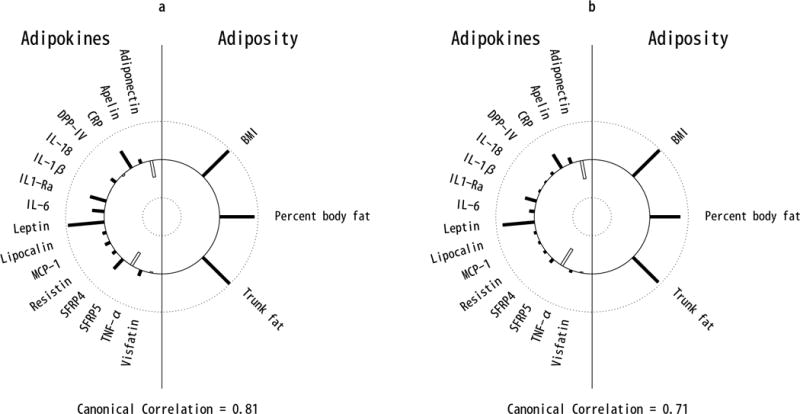
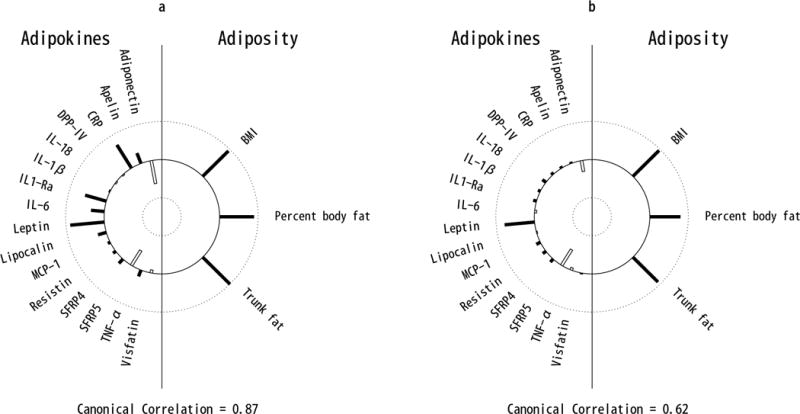
Methods: Participants included 1,213 individuals with cross-sectional data and a subset of 368 individuals with follow-up measures (mean 4.6 ± 1.5 years from baseline). Joint multivariate associations between 3 adiposity measures and 16 adipokines were assessed by canonical correlation analysis.
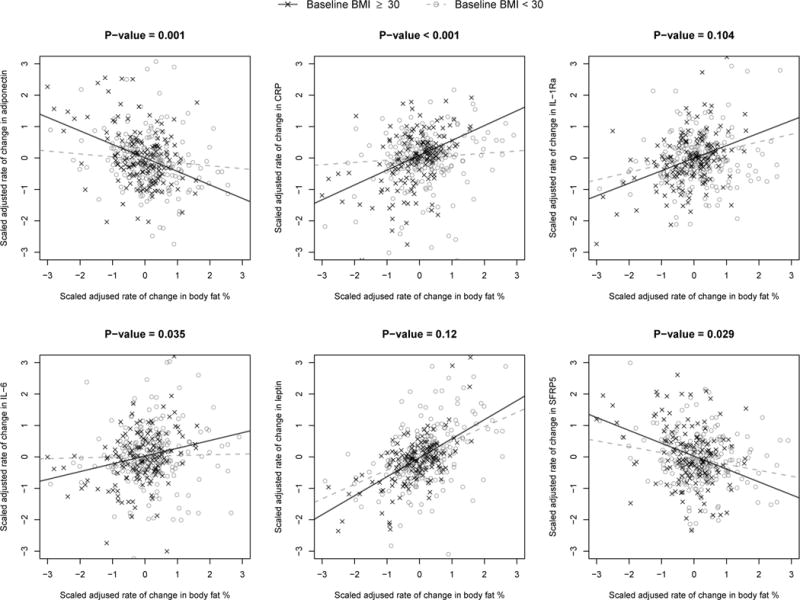
Results: Longitudinal increases in adiposity were most strongly associated with increasing leptin, C-reactive protein (CRP), and interleukin 1 receptor antagonist (IL-1Ra) and decreasing adiponectin and secreted frizzled protein 5 (SFRP5) over time. Participants with BMI ≥ 30 kg/m2 at baseline had greater increases in leptin, CRP, IL-1Ra, and interleukin 6 (IL-6) and greater decreases in adiponectin and SFRP5, associated with increasing adiposity over follow-up, than those with BMI < 30 kg/m2 . Associations between adiposity and adipokines were most accounted for by leptin; adjustment for leptin greatly reduced the magnitude of all associations between adiposity and remaining adipokines.
Conclusions: Increasing adiposity contributes to a worsening imbalance of pro- and anti-inflammatory adipokines over time, in which leptin may have an important role as a key mediator of metabolic disease risk in Mexican Americans.
© 2018 The Obesity Society.
Conflict of interest statement
Figures
Similar articles
-
A diet high in sugar-sweetened beverage and low in fruits and vegetables is associated with adiposity and a pro-inflammatory adipokine profile.Br J Nutr. 2018 Dec;120(11):1230-1239. doi: 10.1017/S0007114518002726. Epub 2018 Oct 30. Br J Nutr. 2018. PMID: 30375290 Free PMC article.
-
The metabolic syndrome is associated with circulating adipokines in older adults across a wide range of adiposity.J Gerontol A Biol Sci Med Sci. 2008 Apr;63(4):414-9. doi: 10.1093/gerona/63.4.414. J Gerontol A Biol Sci Med Sci. 2008. PMID: 18426966 Free PMC article.
-
Overweight, hypertension and cardiovascular disease: focus on adipocytokines, insulin, weight changes and natriuretic peptides.Dan Med J. 2015 Nov;62(11):B5163. Dan Med J. 2015. PMID: 26522487
-
Adipokines, adiposity, and atherosclerosis.Cell Mol Life Sci. 2022 May 3;79(5):272. doi: 10.1007/s00018-022-04286-2. Cell Mol Life Sci. 2022. PMID: 35503385 Free PMC article. Review.
-
A link between sleep loss, glucose metabolism and adipokines.Braz J Med Biol Res. 2011 Oct;44(10):992-9. doi: 10.1590/s0100-879x2011007500113. Epub 2011 Sep 2. Braz J Med Biol Res. 2011. PMID: 21881808 Review.
Cited by
-
The Emerging Role of Sfrp5 and Wnt5a in the Pathogenesis of Obesity: Implications for a Healthy Diet and Lifestyle.Nutrients. 2021 Jul 19;13(7):2459. doi: 10.3390/nu13072459. Nutrients. 2021. PMID: 34371968 Free PMC article. Review.
-
Prospective Study of Long-Term Interrelationships Among Adiposity-Associated Biomarkers in Women.Obesity (Silver Spring). 2020 Feb;28(2):452-459. doi: 10.1002/oby.22706. Epub 2019 Dec 31. Obesity (Silver Spring). 2020. PMID: 31891229 Free PMC article.
-
A diet high in sugar-sweetened beverage and low in fruits and vegetables is associated with adiposity and a pro-inflammatory adipokine profile.Br J Nutr. 2018 Dec;120(11):1230-1239. doi: 10.1017/S0007114518002726. Epub 2018 Oct 30. Br J Nutr. 2018. PMID: 30375290 Free PMC article.
-
Association of weight gain and fifteen adipokines with declining beta-cell function in Mexican Americans.PLoS One. 2018 Aug 13;13(8):e0201568. doi: 10.1371/journal.pone.0201568. eCollection 2018. PLoS One. 2018. PMID: 30102726 Free PMC article.
-
Increases in BMI contribute to worsening inflammatory biomarkers related to breast cancer risk in women: a longitudinal study.Breast Cancer Res Treat. 2023 Nov;202(1):117-127. doi: 10.1007/s10549-023-07023-w. Epub 2023 Aug 5. Breast Cancer Res Treat. 2023. PMID: 37541965
References
-
- Kershaw EE, Flier JS. Adipose tissue as an endocrine organ. The Journal of clinical endocrinology and metabolism. 2004;89:2548–2556. - PubMed
-
- Bluher M. Adipose tissue dysfunction in obesity. Experimental and clinical endocrinology & diabetes: official journal, German Society of Endocrinology [and] German Diabetes Association. 2009;117:241–250. - PubMed
-
- Spalding KL, Arner E, Westermark PO, Bernard S, Buchholz BA, Bergmann O, et al. Dynamics of fat cell turnover in humans. Nature. 2008;453:783–787. - PubMed
-
- Gray SL, Vidal-Puig AJ. Adipose tissue expandability in the maintenance of metabolic homeostasis. Nutrition reviews. 2007;65:S7–12. - PubMed
-
- Rodriguez A, Ezquerro S, Mendez-Gimenez L, Becerril S, Fruhbeck G. Revisiting the adipocyte: a model for integration of cytokine signaling in the regulation of energy metabolism. American journal of physiology Endocrinology and metabolism. 2015;309:E691–714. - PubMed
Publication types
MeSH terms
Substances
Grants and funding
LinkOut - more resources
Full Text Sources
Other Literature Sources
Medical
Research Materials
Miscellaneous
