. 2018 Oct;75(20):3781-3801.
doi: 10.1007/s00018-018-2771-6. Epub 2018 Feb 9.

Dissecting the biochemical architecture and morphological release pathways of the human platelet extracellular vesiculome

Affiliations

Dissecting the biochemical architecture and morphological release pathways of the human platelet extracellular vesiculome

Silvia H De Paoli et al. Cell Mol Life Sci. 2018 Oct.

Abstract

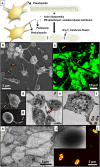
Platelet extracellular vesicles (PEVs) have emerged as potential mediators in intercellular communication. PEVs exhibit several activities with pathophysiological importance and may serve as diagnostic biomarkers. Here, imaging and analytical techniques were employed to unveil morphological pathways of the release, structure, composition, and surface properties of PEVs derived from human platelets (PLTs) activated with the thrombin receptor activating peptide (TRAP). Based on extensive electron microscopy analysis, we propose four morphological pathways for PEVs release from TRAP-activated PLTs: (1) plasma membrane budding, (2) extrusion of multivesicular α-granules and cytoplasmic vacuoles, (3) plasma membrane blistering and (4) "pearling" of PLT pseudopodia. The PLT extracellular vesiculome encompasses ectosomes, exosomes, free mitochondria, mitochondria-containing vesicles, "podiasomes" and PLT "ghosts". Interestingly, a flow cytometry showed a population of TOM20+LC3+ PEVs, likely products of platelet mitophagy. We found that lipidomic and proteomic profiles were different between the small PEV (S-PEVs; mean diameter 103 nm) and the large vesicle (L-PEVs; mean diameter 350 nm) fractions separated by differential centrifugation. In addition, the majority of PEVs released by activated PLTs was composed of S-PEVs which have markedly higher thrombin generation activity per unit of PEV surface area compared to L-PEVs, and contribute approximately 60% of the PLT vesiculome procoagulant potency.

Keywords: Ectosome; Exosome; Extracellular vesicles; Membrane microparticles; Membrane pearling; Mitophagy; Platelet; Thrombin generation.


Figures
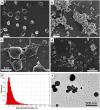
Fig. 1
Fig. 1
Activation by TRAP induces changes in PLT morphology and the release of PEVs with a broad size distribution. FESEM images showing a resting PLTs with a smooth and discoid shape, b activated PLTs with pseudopodia formation and aggregation, c the PEV release process during the early stage of PLT activation (1 min after exposure to TRAP), and d the late stage of PLT activation (20 min after exposure to TRAP). e The PLT extracellular vesiculome size distribution analysis determined by NTA. f A TEM image of a PLT extracellular vesiculome stained with uranyl acetate. Washed PLTs were treated with 20 µmol/L TRAP in Tyrode’s buffer for 30 min with gentle agitation at RT; results are representatives of at least three independent experiments
Fig. 2
Fig. 2
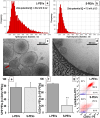
Characterization of two major PEV populations isolated by differential centrifugation. L-PEVs and S-PEVs were isolated by centrifuging the PLT extracellular vesiculome at 20,000 and 100,000g, respectively. The NTA size distribution and zeta potential values for a L-PEVs and b S-PEVs; representative cryo-TEM images of c L-PEVs and d S-PEVs; FC analysis of surface-exposed phosphatidylserine (lactadherin binding): e % of PS+ PEVs in CD41a+ PEVs and f % of CD41a+ PEVs in PS+ PEVs. Representatives FC scatter plots of FITC-lactadherin and PE-CD41a-antibody labeled PEVs. PLT extracellular vesiculome was obtained from TRAP-activated washed PLTs in Tyrodes buffer (20 µmol/L TRAP for 30 min with gentle agitation); the arrow in c indicates a mitochondrion; results are representatives of at least n = 3 experiments; error bars indicate SD; **P < 0.01
Fig. 3
Fig. 3
Thrombin generation (TG) assay demonstrates the procoagulant activities of L-PEVs and S-PEVs. a TG curves for L-PEVs and S-PEVs (different PEVs concentrations and in the presence of 10 µmol/L of lactadherin). b Thrombin peak height (TPH) per 1 nm2 of PEV surface area; mean THP/nm2 of PEV surface area were evaluated from TPH of PEV concentrations in the middle of dose response linear range, the surface area was estimated from mean diameter of S-PEVs (103 nm) and L-PEVs (350 nm) and PEV concentrations assayed by NTA. c % relative abundance of S-PEVs and L-PEVs in the PLT extracellular vesiculome (determined by NTA analyses; *P or #P < 0.05, ***P < 0.001) and % relative contribution of S-PEVs and L-PEVs to TG by the PLT extracellular vesiculome (#P < 0.05). Total TG activity of PLT extracellular vesiculome was a sum of TG activity of S-PEVs and L-PEVs, calculated from respective TPH/nm2 × PEV surface area × PEV concentration. PLT extracellular vesiculome was from TRAP-activated PLTs in Tyrodes buffer (20 µmol/L TRAP for 30 min, RT with gentle agitation) subjected to 2-step centrifugation to isolate S-PEVs and L-PEVs; results are representatives of at least n = 3 experiments; error bars indicate SD
Fig. 4
Fig. 4
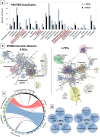
Overview of protein classes distribution present in the S-PEVs and L-PEVs as identified by MS-proteomics. a PANTHER [40] analysis indicates four protein classes that are unique to L-PEVs; b protein functional interaction networks generated by STRING [41] database indicating four distinct functional clusters in L-PEVs: vesicle transport, ATP, binding, actin and clathrin. STRING networks were generated with a confidence level of 0.95 and maximum of 50 iterations; c circular plot with the identified proteins for S-PEVs and L-PEVs compared against the mitochondria, 26S proteasome, autophagy and autophagosome proteome databases (UniprotKB) and against the PEVs proteome database [108]: S-PEVs (red), L-PEVs (blue), PEVs-reference (whole PLT extracellular vesiculome; light green), autophagosome (gray), autophagy (black), proteasome (dark green) and mitochondria (violet); d Venn diagram with analysis of the S-PEVs, L-PEVs and referenced proteome databases
Fig. 5
Fig. 5
Analysis of PEVs origins by LSCM and FC. a Cartoon representation of labeling of PLT plasma membrane (PM) and released extracellular vesiculome: plasma membrane (PM) of resting PLT was labeled with red-fluorescent CellMask (CM) dye and PLTs were activated with TRAP; the released extracellular vesiculome was labeled with a non-specific green-fluorescent membrane dye DHPE. b LSCM images show PEVs that originate from PLT PM (including open canalicular system) in red or orange; the green-labeled PEVs are from internal membranes and their release do not hijack portions of PLT PM. c, d FC analysis confirm that PEVs are originated from both PLT PM and internal membranes. PLTs were labeled with CellMask for only 15 min to prevent labeling of internal membranes. c Bar graph shows % of FC-detectable CM+DHPEPEVs (red), DHPE+CMPEVs (green) and CM+DHPE+PEVs in total population of membrane labeled PEVs; d representative double fluorescent plot of non-labeled PEVs control and PEVs labeled as described above. Washed PLTs were activated with 20 µmol/L TRAP for 30 min., RT with gentle agitation, and the PLT extracellular vesiculome was isolated from PLT aggregates by centrifugation at 1000g for 15 min. Results are representatives of n = 3 experiments
Fig. 6
Fig. 6
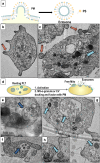
TEM images demonstrate that activated PLTs release ectosomes, exosome-like vesicles from multivesicular (MV)-α-granules and organelles entrapped in cytoplasmic vacuoles (CVs). a Graphic demonstration of membrane budding and ectosome release [2]; b, c TEM image showing PM ruffles and release of ectosomes; d graphic demonstration of CVs [74, 79], MV-α-granules [17, 45] and other granules releasing contents after docking and fusing with PM [75]; TEM image showing e MV-α-granule in close proximity to the PM and f MV-α-granules releasing exosome-like vesicles, as pointed by the dark blue arrows; c, g, h organelles entrapped inside CVs (light blue arrows) and h the release of an organelle from CV fusion with the PM. PLTs were activated with TRAP (20 µmol/L TRAP for 30 min, RT with gentle agitation) in Tyrodes buffer (b, e) or plasma (c, f, g, h); results are representatives of four individual experiments
Fig. 7
Fig. 7
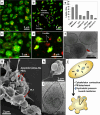
The TRAP-activated PLT extracellular vesiculome contained “free” mitochondria and vesicles containing mitochondria. LSCM images of membrane and mitochondria of a resting PLTs and b the PLT extracellular vesiculome labeled with Green-CellMask™ and Red-TOM20ab. PLTs labeled with Green-CellMask™ and Red-MitoTracker c before and d after activation; e FC analysis confirmed that PLT extracellular vesiculome contain mitochondria and showed that a portion of PEVs positive for mitochondrial markers (TOM20, mitotracker) also carry the autophagosomal marker LC3. The bar graph shows % of Mitotracker+PEVs, TOM20+PEVs, LC3+PEVs, TOM+20LC3+PEVs, CD41a+PEVs, CD41a+TOM20+PEVs, CD41a+LC3+PEVs in total PLT extracellular vesiculome labeled by DHPE (DHPE+PEVs), see SI Fig. 6 for representative scatter plots; f Cryo-TEM image of a mitochondrion (double bilayer) [19] in L-PEVs; g, h FESEM images showing large membrane blisters that resemble apoptotic bodies; i cryo-TEM image of a large vesicle containing organelles present in the extracellular vesiculome; j graphic illustration of a proposed mechanism for organelle sequestration into vesicles: PLT activation induces cytoskeleton contraction [49] with consequent PM detachment with increase in hydrostatic pressure toward PM [50, 109] causing peripheralization of organelles [81]. PLTs were activated with TRAP (20 µmol/L TRAP for 30 min, RT with gentle agitation) in Tyrodes buffer (ad, h) or plasma (f, g); results are representatives of three independent experiments. Error bars indicate SD
Fig. 8
Fig. 8
Podiasomes and PLT “ghosts” are part of the PLT extracellular vesiculome. a Graphic illustration of podiasome formation involving actin disassembly, PM detachment, and membrane pearling [52, 55, 92] followed by membrane fission [–101]. The pearling of PLT pseudopodia was observed by b, d, g FESEM, c LCSM and e, f TEM; h TEM of PLT “ghosts”, i cryo-TEM of a PLT ghost in L-PEVs, j LSCM of PLT “ghosts” labeled with the a membrane stain (Texas Red-DHPE) and PS binding FITC-annexin-V. PLTs were activated with TRAP (20 µmol/L TRAP for 30 min, RT with gentle agitation) in Tyrodes buffer (b, d, e, g) or plasma (platelet-rich plasma; c, f). To prevent artifacts, samples were fixed in 4% PF before adsorption onto glass surfaces (bd, g). Images are representatives of four independent experiments

Similar articles

Cited by

References

    1. Tkach M, Thery C. Communication by extracellular vesicles: where we are and where we need to go. Cell. 2016;164:1226–1232. - PubMed
    1. Cocucci E, Meldolesi J. Ectosomes and exosomes: shedding the confusion between extracellular vesicles. Trends Cell Biol. 2015;25:364–372. - PubMed
    1. Wolf P. The nature and significance of platelet products in human plasma. Br J Haematol. 1967;13:269–288. - PubMed
    1. Phipps RP. Platelets at the interface between thrombosis, inflammation and immunity. Thromb Res. 2011;127:179. - PubMed
    1. Stokes KY, Granger DN. Platelets: a critical link between inflammation and microvascular dysfunction. J Physiol Lond. 2012;590:1023–1034. - PMC - PubMed

MeSH terms

LinkOut - more resources