. 2018 Jan 25:9:59.
doi: 10.3389/fimmu.2018.00059. eCollection 2018.

Identification of a Potential Common Ancestor for Mammalian Cross-Presenting Dendritic Cells in Teleost Respiratory Surfaces

Affiliations

Identification of a Potential Common Ancestor for Mammalian Cross-Presenting Dendritic Cells in Teleost Respiratory Surfaces

Irene Soleto et al. Front Immunol. .

Abstract

Dendritic cells (DCs) are highly specialized antigen-presenting cells that bridge innate and adaptive immune responses in vertebrates, being key modulators in the initiation of specific responses. Although teleost fish present the main elements of a fully developed adaptive immune system, not many studies have focused on identifying specific DC subsets in teleost species. Previous work from our group identified in rainbow trout (Oncorhynchus mykiss) skin a DC subpopulation co-expressing CD8α and major histocompatibility complex II β on the cell surface. Interestingly, these CD8+ DCs expressed common unique markers of mammalian cross-presenting DCs, a DC subset with an important role in antigen presentation and activation of CD8+ T cytotoxic lymphocytes. In this study, we have identified a similar DC subset in rainbow trout gills that also transcribes molecules uniquely expressed on diverse mammalian cross-presenting DC populations such as CD8, CD103, CD141, Batf3, IFN regulatory protein 8, and toll-like receptor 3. Hence, we have undertaken a broad phenotypic and functional characterization of this new DC subset that includes the confirmation of novel capacities for DCs in teleost, such an IgM-binding capacity and responsiveness to CD40 ligand. Furthermore, our results show that in gills, this DC subset shows some different phenotypic and functional characteristics when compared with their homologs in the skin, suggesting an adaptation of the cells to different mucosal tissues or different maturation status depending on their location. Our findings contribute to increase our knowledge on fish cross-presenting DCs, an important cell population to take into account for the future design of mucosal vaccination strategies.

Keywords: CD8; cross-presentation; dendritic cells; gills; major histocompatibility complex II; rainbow trout; respiratory surfaces.


Figures
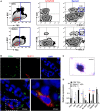
Figure 1
Figure 1
Identification and characterization of gill CD8α+ major histocompatibility complex (MHC) II+ cells. (A) Flow cytometry analysis of rainbow trout leukocytes isolated from gills (top panels) and spleen (bottom panels) stained with anti-CD8α and anti-MHC II mAbs. FSC/SSC profiles are shown (left) and gates for lymphoid (L) and myeloid (M) cells defined. Two-color CD8/MHC class II dot plots of lymphoid and myeloid gated cells are also shown. Percentage of myeloid CD8+MHC IIhi cells among the total number of cells in each gate is shown in the upper right corner. (B) Cryostat sections were prepared from rainbow trout gill, fixed and labeled with anti-CD8α (green) and anti-MHC class II (red) Abs, counterstained with DAPI (blue), and analyzed by fluorescence microscopy. A representative image is shown, together with a magnification of a CD8+ dendritic cell (DC) (right). (C) CD8α+MHC II+ cells from gills were isolated by cell sorting and then incubated onto poly-l-lysine-treated glass slides, fixed, mounted, and analyzed by light microscopy (scale bar, 5 µm). (D) Gill CD8+ DCs and splenic CD8+ T cells were isolated by flow cytometry and RNA obtained. RNA was also obtained from the RTS11 monocyte–macrophage cell line. These RNAs were used to study the levels of transcription of different marker genes by real-time PCR. Relative expression of the indicated genes to the endogenous control elongation factor 1α was calculated for each sample value. Mean values (+SD) from three independent experiments are shown. Asterisks in red indicate significant differences between values obtained in gill CD8+ DCs and splenic CD8+ T cells, whereas asterisks in blue denote significant differences between values obtained in gill CD8+ DCs and RTS11 cells (*p ≤ 0.05, **p ≤ 0.01, and ***p ≤ 0.005).
Figure 2
Figure 2
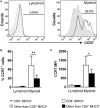
Phagocytic capacity of gills CD8+ dendritic cells (DCs). Leukocytes from gills were incubated with Crimson Red fluorescent polystyrene beads (1 µm diameter) at a ratio of 1:10 (cell/beads) for 16 h. Non-ingested beads were removed in a glucose gradient, and the cells were stained with anti-CD8α and analyzed by flow cytometry (A). Lymphoid cells (upper panels) and myeloid cells (lower panels) were gated, and CD8 and CD8+ cells were further selected to analyze and measure the fluorescence of internalized beads (histograms). The percentage of cells containing beads was determined using control samples without beads to establish the phagocytosis gate shown in the histograms. The average percentage of phagocytic CD8 and CD8+ cells (B) and the mean fluorescence intensity (MFI) of the internalized beads (C) were used to determine the phagocytic capacity of each cell type. Data are representative of 11 individual fish from 5 different experiments. (D) Cytochalasin (0.05 µg/ml) was added to the cells immediately before the addition of the beads to demonstrate active phagocytosis. Results are shown as the percentage of phagocytic gill CD8+ DCs relative to that of untreated controls (five individual fish) (***p ≤ 0.005).
Figure 3
Figure 3
T cell-activating capacity of gill CD8+ dendritic cells (DCs). Trout gill CD8+ DCs were isolated by flow cytometry. Cells were then cultured for 12 h in L-15 medium supplemented with 20% fetal calf serum in presence of the T cell-dependent Ag TNP hapten conjugated to the keyhole limpet hemocyanin. Thereafter, DCs were cocultured with isogenic T cell-enriched fractions obtained from the spleen of these same animals [auto-mixed leukocyte reaction (MLR)], previously labeled with CFSE. Cocultures were set at a ratio of 1:30 (DC:T cells) and incubated for 5 days. After this time, the cultures were analyzed by flow cytometry to measure the level of CFSE dilution. (A) A representative example from eight individuals is shown, and the percentage of proliferating cells is indicated. (B) Average percentages of proliferating cells were calculated (n = 8, mean + SD) (**p ≤ 0.01).
Figure 4
Figure 4
Expression of surface CCR7 on gill CD8+ dendritic cells (DCs). Trout leukocytes from gills were isolated, stained with specific Abs against CD8α, major histocompatibility complex (MHC) II and CCR7, and analyzed by multicolor flow cytometry. (A) Cells were gated as lymphoid and myeloid on the basis of their FSC and SSC. Then, CD8+MHC II+ cells were further gated on those populations, and CCR7 fluorescence was determined in CD8+ DCs (open line histograms) and compared against the general CCR7 levels in each gate (filled line histograms). Numbers on plots correspond to the percentage of CCR7+ cells after exclusion of negative cells present on the isotype controls. Average percentage of CCR7 cells (B) and MFI of CCR7 expression (C) in gill lymphoid and myeloid populations were calculated. Data are representative of nine individual fish from three independent experiments (*p ≤ 0.05 and **p ≤ 0.01).
Figure 5
Figure 5
Transcription of toll-like receptor (TLR) genes and markers of mammalian cross-presenting dendritic cells (DCs) on gill CD8+ DCs. CD8+ DCs and splenic CD8+ T cells were isolated by flow cytometry, and RNA obtained. RNA was also obtained from the RTS11 monocyte–macrophage cell line. These RNAs were used to study the levels of transcription of the different TLRs (A) and other markers of cross-presenting DCs (B) by real-time PCR. Relative expression levels of the indicated genes to the endogenous control elongation factor 1α were calculated for each sample value (mean + SD; n = 3–7). Asterisks in red indicate significant differences between values obtained in gill CD8+ DCs and splenic CD8+ T cells, whereas asterisks in blue denote significant differences between values obtained in gill CD8+ DCs and RTS11 cells (*p ≤ 0.05 and **p ≤ 0.01).
Figure 6
Figure 6
IgM-binding capacity of gill CD8+ dendritic cells (DCs). Gill leukocytes were incubated with purified IgM for 1 h at 20°C. Thereafter, cells were stained with specific Abs against CD8α, major histocompatibility complex (MHC) II, and IgM and analyzed by flow cytometry. Leukocytes were gated as lymphoid (A) and myeloid (B) cells on the basis of their FSC and SSC. Then, CD8+MHC II+ cells were further gated on those populations, and the IgM-binding capacity determined in CD8+ DCs (open line histograms) and compared against the general levels of IgM binding in lymphocytes and myeloid cells (filled line histograms). Data represent the IgM+ cells population after exclusion of negative cells present on the isotype controls. (C,D) Average percentage of IgM+ cells (left panels) and the MFI of IgM (right panels) within lymphoid (C) and myeloid (D) cells are shown. Data are representative of seven individual fish from two independent experiments (**p ≤ 0.01).
Figure 7
Figure 7
CD40 ligand (CD40L) stimulates gill CD8+ dendritic cells (DCs). (A) CD8+ DCs from gills, together with T cells and IgM+ B cells from spleen, were isolated by FACS sorting, and total RNA was obtained. The relative expression of CD40 and CD40L to the endogenous control elongation factor 1α was calculated for each sample, and mean (+SD) values from two experiments, involving three animals per experiment, were calculated. Asterisks denote statistically significant differences between indicated groups. (B) Gill leukocytes were incubated with CD40L during 48 h and then stained with anti-CD8α and anti-major histocompatibility complex (MHC) II mAbs. FSC/SSC profiles are shown (left), and a gate for myeloid cells was defined. Two-color CD8/MHC class II dot plots of myeloid gated cells are also shown (right panels). Percentage of myeloid CD8+MHC II+ cells among the total number of cells in each gate is shown in the upper right corner. Average percentage of CD8+ DCs in control medium or treated with CD40L was calculated (C), as well as the MFI of MHC II on these populations (D). The percentage of CD8+ DCs and the MFI of MHC II are also shown for each individual fish. Data are represented as mean + SD (n = 6). Asterisks denote statistically significant differences between the values obtained in the CD40L-treated group and the corresponding untreated group (*p ≤ 0.05 and **p ≤ 0.01).

Similar articles

Cited by

References

    1. Steinman RM, Hawiger D, Liu K, Bonifaz L, Bonnyay D, Mahnke K, et al. Dendritic cell function in vivo during the steady state: a role in peripheral tolerance. Ann N Y Acad Sci (2003) 987:15–25.10.1111/j.1749-6632.2003.tb06029.x - DOI - PubMed
    1. Mellman I, Steinman RM. Dendritic cells: specialized and regulated antigen processing machines. Cell (2001) 106:255–8.10.1016/S0092-8674(01)00449-4 - DOI - PubMed
    1. Savina A, Amigorena S. Phagocytosis and antigen presentation in dendritic cells. Immunol Rev (2007) 219:143–56.10.1111/j.1600-065X.2007.00552.x - DOI - PubMed
    1. Lovy J, Savidant GP, Speare DJ, Wright GM. Langerin/CD207 positive dendritic-like cells in the haemopoietic tissues of salmonids. Fish Shellfish Immunol (2009) 27:365–8.10.1016/j.fsi.2009.01.006 - DOI - PubMed
    1. Haugland GT, Jordal AE, Wergeland HI. Characterization of small, mononuclear blood cells from salmon having high phagocytic capacity and ability to differentiate into dendritic like cells. PLoS One (2012) 7:e49260.10.1371/journal.pone.0049260 - DOI - PMC - PubMed

Publication types

MeSH terms